Quantitative Analysis(APD pt.1)
Quantitative analysis (Ticker: APD)
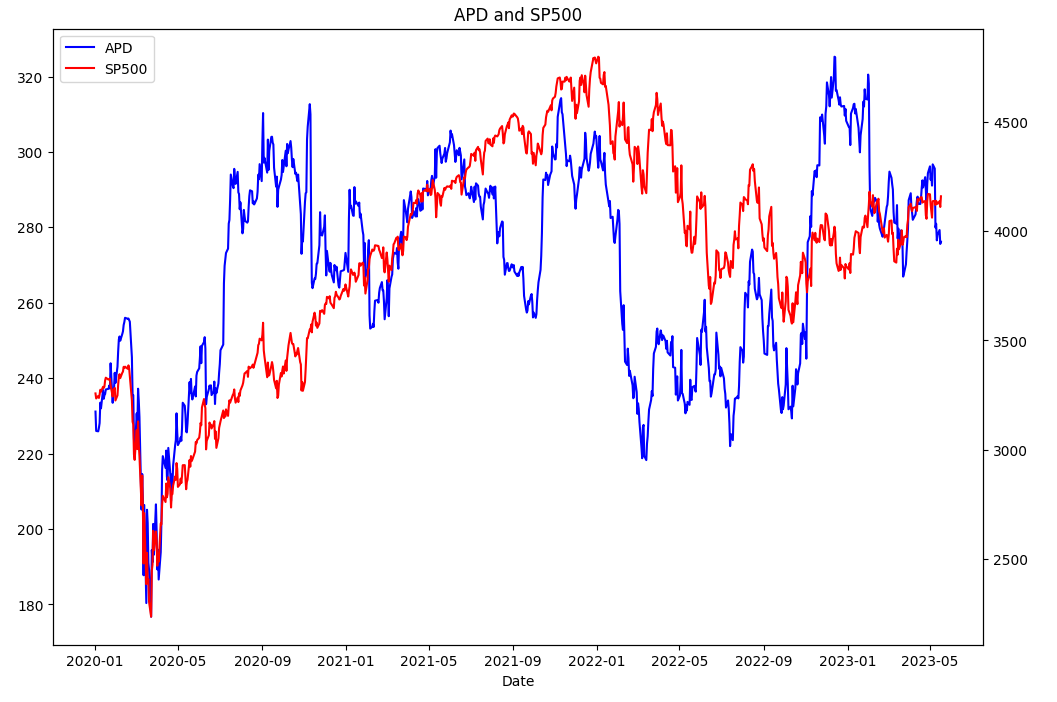
APD compares S&P500 index
Import all libraries needed
pip install finance-datareader openai pyfolio finvizfinance yfinance
import pandas as pd
import FinanceDataReader as fdr
import matplotlib.pyplot as plt
import yfinance as yf
import pyfolio as pf
from finvizfinance.screener.overview import Overview
from finvizfinance.insider import Insider
from finvizfinance.news import News
from finvizfinance.quote import finvizfinance
IPython_default = plt.rcParams.copy()
plt.style.use('tableau-colorblind10')
Pull APD and S&P500 data to compare with the specific date.
I pulled the data from 2020-01-01 to 2023-05-18.
apd = fdr.DataReader('apd', '2020-01-01', '2023-05-18')
sp500 = fdr.DataReader('us500', '2020-01-01', '2023-05-18')
fig, ax = plt.subplots(figsize=(12,8))

l1 = ax.plot(apd[['Close']], color='blue', label='APD')
ax.set_title('APD and SP500')
ax.set_xlabel('Date')

ax2 = ax.twinx()

l2 = ax2.plot(sp500[['Close']], color='red', label='SP500')
ax.grid
ax.legend(handles=l1+l2, loc=2)
plt.show()
The chart shows that APD’s price is not S&P500 index, it has more volatility.
returns = (apd[['Close']].pct_change()+1).product()-1
returns
Close    0.194947
dtype: float64
df = pd.DataFrame()

df['SP500'] = sp500.loc['2020-01-01':'2023-05-19', 'Close']
df['APD'] = apd.loc['2020-01-01':'2023-05-19', 'Close']

df.head()
                  SP500         APD
Date
2020-01-02  3257.850098  231.139999
2020-01-03  3234.850098  226.000000
2020-01-06  3246.280029  225.899994
2020-01-07  3237.179932  226.860001
2020-01-08  3253.050049  228.089996
changes = df.pct_change()
corr = changes.corr()
corr.head()
          SP500       APD
SP500  1.000000  0.721876
APD    0.721876  1.000000
plt.figure(figsize=(16,8))
plt.grid(False)
plt.imshow(corr, cmap='hot', interpolation='none')
plt.colorbar()
plt.xticks(range(len(corr)), corr.columns, rotation=90)
plt.yticks(range(len(corr)), corr.columns)
plt.show()
<Figure size 1600x800 with 2 Axes>
msdf = pd.DataFrame()

msdf['Mean'] = changes.mean()
msdf['Standard Deviation'] = changes.std()

msdf
           Mean  Standard Deviation
SP500  0.000408            0.015461
APD    0.000410            0.019988
# 2020-2023 returns and risk

plt.figure(figsize=(16,8))
plt.scatter(changes.mean(), changes.std())
plt.xlabel('returns')
plt.ylabel('risk')
plt.xlim(0.0003,0.0005)
plt.ylim(0,0.0)
for label, x, y in zip(changes.columns, changes.mean(), changes.std()):
    plt.annotate(label, xy=(x, y), xytext=(30, -30),
    textcoords = 'offset points',
    ha = 'right', va = 'bottom',
    bbox = dict(boxstyle = 'round,pad=0.5', fc = 'green', alpha = 0.5),
    arrowprops = dict(arrowstyle = '->', connectionstyle = 'arc3, rad=0'))
<Figure size 1600x800 with 1 Axes>
tickers = ['APD','^GSPC']

# df_close = fdr.DataReader('TIO')
# df_close = df_close[['Close']]

df_close = yf.download(tickers=tickers,
                       start='2020-01-01',
                       interval='1d',
                       auto_adjust=True
                       )['Close']

weights = [1,0]

print('Start date of each stock')
print('-'*25)
for ticker in tickers:
    print(f"{ticker}: {df_close[[ticker]].dropna().iloc[0].name.strftime('%Y-%m-%d')}")
print('-'*25)
[                       0%                       ]
[*********************100%***********************]  2 of 2 completed
Start date of each stock
-------------------------
APD: 2020-01-02
^GSPC: 2020-01-02
-------------------------
cdf = df_close.dropna()

target_end_date = pd.to_datetime('2023-05-19')

time_period = cdf.index.to_frame()
trading_period = time_period.resample('BM').last().iloc[::12, :].rename(columns={'Date':'start_date'})
trading_period = trading_period.assign(end_date=trading_period.start_date.shift(-1).fillna(time_period.iloc[-1].name)) # 'time_period.iloc[-1].name' up to date instead of target date


trading_period
           start_date   end_date
Date
2020-01-31 2020-01-31 2021-01-29
2021-01-29 2021-01-29 2022-01-31
2022-01-31 2022-01-31 2023-01-31
2023-01-31 2023-01-31 2023-05-19
import numpy as np

def get_mdd(cdf_price, start, end, col):
  cdf_price = cdf_price[start:end].copy()
  return ((cdf_price[col]-cdf_price[col].cummax())/cdf_price[col].cummax()).cummin()

def get_pf_returns(cdf_price, tickers, start, end, weights=weights, use_signal=None):
  # if weights is None:
  #   weights = [1/len(tickers) for _ in range(len(tickers))]

  # calculate daily returns
  ret_dict = {f"{ticker}"+"_RET": cdf_price[ticker].pct_change().fillna(0) for ticker in tickers}
  cdf_price = cdf_price.assign(**ret_dict)

  # select data within the trading period
  df_trade = cdf_price.loc[start:end].copy()

  # assign 0 for the first row. returns can't be calculated on the first trading day
  df_trade.loc[start, :] = 0

  # calculate daily portfolio returns
  df_trade = df_trade.assign(PF_RET=df_trade[ret_dict.keys()].dot(weights))

  # calculate cumulative returns within the trading period
  cumret_dict = {f"{col}_CUMRET": (1+df_trade[f"{col}_RET"]).cumprod() for col in tickers}

  port_cumret = np.cumprod(1+df_trade[ret_dict.keys()].dot(weights))
  df_trade = df_trade.assign(PF_RET=df_trade[ret_dict.keys()].dot(weights), **cumret_dict,
                             PF_CUMRET=port_cumret)
  cumret_cols = [col for col in df_trade.columns if 'CUMRET' in col]

  # calculate MDD within the trading period
  mdd_dict = {col.split('_')[0] +'_MDD': get_mdd(cdf_price = df_trade,
                                                 start=df_trade.index[0],
                                                 end=df_trade.index[-1],
                                                 col=col)
                                                 for col in cumret_cols}

  df_trade = df_trade.assign(**mdd_dict)

  return df_trade
df_res = pd.DataFrame()
for i in range(len(trading_period)):
  df_trade = get_pf_returns(cdf_price = cdf,
                            tickers=tickers,
                            start=trading_period.iloc[i].start_date,
                            end=trading_period.iloc[i].end_date)
  df_res=pd.concat([df_res, df_trade], axis=0)


df_res = df_res.reset_index().drop_duplicates(['Date'], keep='first').set_index('Date')
df_res
                   APD        ^GSPC   APD_RET  ^GSPC_RET    PF_RET  \
Date
2020-01-31    0.000000     0.000000  0.000000   0.000000  0.000000
2020-02-03  225.553452  3248.919922  0.018014   0.007255  0.018014
2020-02-04  229.340332  3297.590088  0.016789   0.014980  0.016789
2020-02-05  232.301193  3334.689941  0.012910   0.011251  0.012910
2020-02-06  233.025162  3345.780029  0.003117   0.003326  0.003117
...                ...          ...       ...        ...       ...
2023-05-15  279.290009  4136.279785  0.004640   0.002958  0.004640
2023-05-16  275.589996  4109.899902 -0.013248  -0.006378 -0.013248
2023-05-17  276.200012  4158.770020  0.002213   0.011891  0.002213
2023-05-18  275.450012  4198.049805 -0.002715   0.009445 -0.002715
2023-05-19  278.910004  4191.979980  0.012561  -0.001446  0.012561

            APD_CUMRET  ^GSPC_CUMRET  PF_CUMRET  APD_MDD  ^GSPC_MDD   PF_MDD
Date
2020-01-31    1.000000      1.000000   1.000000  0.00000   0.000000  0.00000
2020-02-03    1.018014      1.007255   1.018014  0.00000   0.000000  0.00000
2020-02-04    1.035105      1.022344   1.035105  0.00000   0.000000  0.00000
2020-02-05    1.048469      1.033846   1.048469  0.00000   0.000000  0.00000
2020-02-06    1.051736      1.037284   1.051736  0.00000   0.000000  0.00000
...                ...           ...        ...      ...        ...      ...
2023-05-15    0.876878      1.014640   0.876878 -0.16714  -0.077516 -0.16714
2023-05-16    0.865262      1.008169   0.865262 -0.16714  -0.077516 -0.16714
2023-05-17    0.867177      1.020156   0.867177 -0.16714  -0.077516 -0.16714
2023-05-18    0.864822      1.029792   0.864822 -0.16714  -0.077516 -0.16714
2023-05-19    0.875685      1.028303   0.875685 -0.16714  -0.077516 -0.16714

[832 rows x 11 columns]
plt.rcParams.update(IPython_default);
plt.style.use('_mpl-gallery')
colors =['blue','red','green']
(1+df_res[['APD_RET', '^GSPC_RET']]).cumprod().plot(figsize=(12,8), linewidth=1, color=colors)
plt.title('Cumulative returns')
plt.tight_layout();
<Figure size 1200x800 with 1 Axes>
pf.show_perf_stats(returns=df_res.PF_RET)
/usr/local/lib/python3.10/dist-packages/pyfolio/timeseries.py:724: FutureWarning: The default dtype for empty Series will be 'object' instead of 'float64' in a future version. Specify a dtype explicitly to silence this warning.
  stats = pd.Series()
/usr/local/lib/python3.10/dist-packages/pyfolio/plotting.py:648: FutureWarning: iteritems is deprecated and will be removed in a future version. Use .items instead.
  for stat, value in perf_stats[column].iteritems():
</pre>