News Sentiment Analysis
News Sentiment Analysis
In this article, I will conduct an in-depth analysis of an interactive stock sentiment treemap for the S&P 500.
The primary objective is to comprehend the prevailing public sentiment for each individual stock.
Let’s delve deeper into understanding what the collective opinion implies for each of these stocks.
You are able to see this treemap in this link
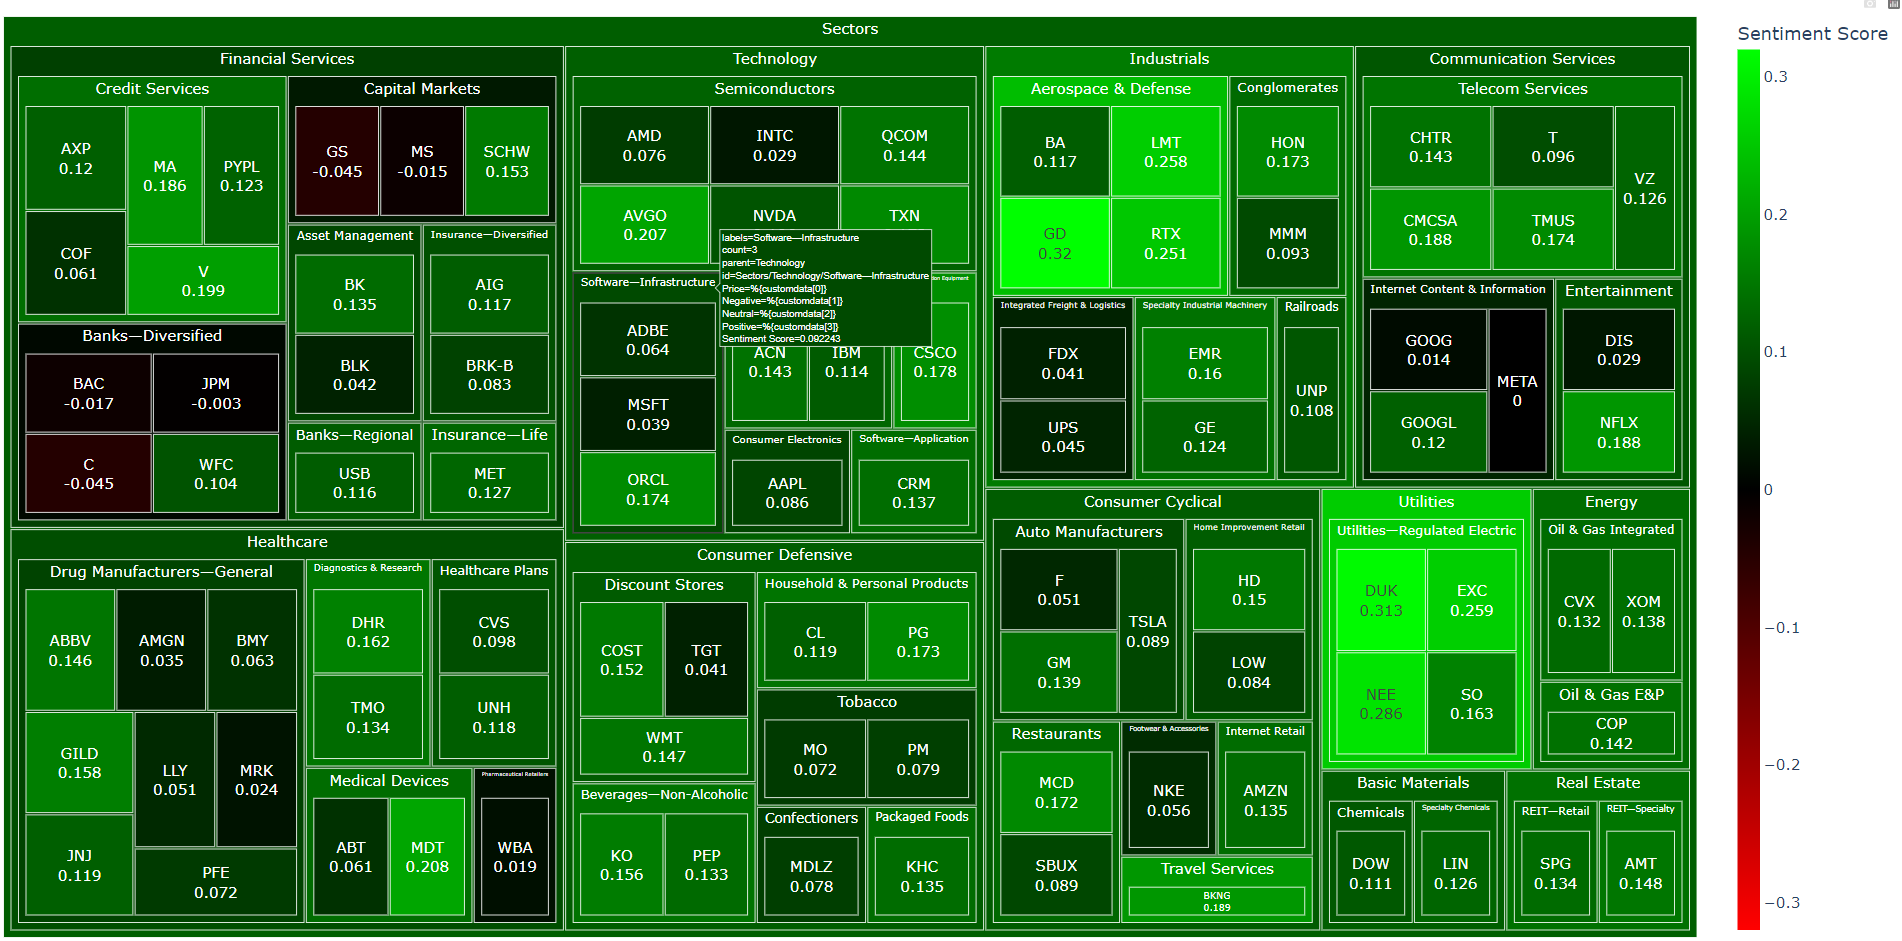
Upon analysis, it appears that the majority of stocks within the S&P 500 are associataed with positive news sentiments.
Utilizing python to analyze
Importing libraries and data
The methodology involved parsing stock data from Yahoo Finance, conducting data manipulation using the pandas library and visualization with matplotlib. The final stage incorporated the use of Natural Language Toolkit(NLTK) for sentiment analysis through machine learning techniques.
# libraries for webscraping, parsing and getting stock data
from urllib.request import urlopen, Request
from bs4 import BeautifulSoup
import yfinance as yf

# for plotting and data manipulation
import pandas as pd
import matplotlib.pyplot as plt
%matplotlib inline
import plotly
import plotly.express as px

# NLTK VADER for sentiment analysis
import nltk
from nltk.sentiment.vader import SentimentIntensityAnalyzer

import requests as r
import io
data_link = 'https://www.dropbox.com/s/6kh2u0qotscww5n/component.csv?raw=1'

response = r.get(data_link)
content = io.StringIO(response.text)
data = pd.read_csv(content)

stocks = data['Symbol']
sector = data['Sector']

tickers = stocks
number_of_shares = tickers_dict.values()
import time
##### Scrape the Date, Time and News Headlines Data
finwiz_url = 'https://finviz.com/quote.ashx?t='
news_tables = {}

for ticker in tickers:
    # print(ticker)
    url = finwiz_url + ticker
    req = Request(url=url,headers={'User-Agent': 'Mozilla/5.0 (Windows NT 6.1; WOW64; rv:20.0) Gecko/20100101 Firefox/20.0'})
    response = urlopen(req)
    # Read the contents of the file into 'html'
    html = BeautifulSoup(response)
    # Find 'news-table' in the Soup and load it into 'news_table'
    news_table = html.find(id='news-table')
    # Add the table to our dictionary
    news_tables[ticker] = news_table

    time.sleep(0.5)

news_table
<table border="0" cellpadding="1" cellspacing="0" class="fullview-news-outer" id="news-table" width="100%">
<tr class="cursor-pointer" onclick="trackAndOpenNews(event, 'Motley Fool', 'https://finance.yahoo.com/m/d43d6e0d-bc30-3edf-a242-54ff19ab00cd/exxonmobil-is-spending-%244.9.html');">
<td align="right" width="130">
            Jul-14-23 07:15AM
        </td>
<td align="left">
<div class="news-link-container">
<div class="news-link-left">
<a class="tab-link-news" href="https://finance.yahoo.com/m/d43d6e0d-bc30-3edf-a242-54ff19ab00cd/exxonmobil-is-spending-%244.9.html" rel="nofollow" target="_blank">ExxonMobil Is Spending $4.9 Billion to Accelerate Its Lower-Carbon Energy Ambitions</a>
</div>
<div class="news-link-right">
<span>(Motley Fool)</span></div></div></td></tr>
<tr class="cursor-pointer" onclick="trackAndOpenNews(event, 'The Wall Street Journal', 'https://finance.yahoo.com/m/232999ff-2ca0-3cc5-b59d-fac8c75cc10b/exxon-buys-pipeline-operator%2C.html');">
<td align="right" width="130">
            Jul-13-23 09:18PM
        </td>
<td align="left">
<div class="news-link-container">
<div class="news-link-left">
<a class="tab-link-news" href="https://finance.yahoo.com/m/232999ff-2ca0-3cc5-b59d-fac8c75cc10b/exxon-buys-pipeline-operator%2C.html" rel="nofollow" target="_blank">Exxon Buys Pipeline Operator, Making Big Bet on Carbon</a>
</div>
<div class="news-link-right">
<span>(The Wall Street Journal)</span></div></div></td></tr>
<tr class="cursor-pointer" onclick="trackAndOpenNews(event, 'Investopedia', 'https://finance.yahoo.com/m/9865fa15-e7f0-3f3e-b4ee-55f258aa64c8/exxon-acquires-denbury-for.html');">
<td align="right" width="130">
            04:30PM
        </td> ...
##### Parse the Date, Time and News Headlines into a Python List
parsed_news = []
# Iterate through the news
for file_name, news_table in news_tables.items():
    # Iterate through all tr tags in 'news_table'
    for x in news_table.findAll('tr'):
        # Check if the 'a' tag exists within the 'tr' tag
        if x.a is not None:
            # Read the text from the 'a' tag
            text = x.a.get_text()
            date_scrape = x.td.text.split()
            # if the length of 'date_scrape' is 1, load 'time' as the only element
            if len(date_scrape) == 1:
                time = date_scrape[0]

            # else load 'date' as the 1st element and 'time' as the second
            else:
                date = date_scrape[0]
                time = date_scrape[1]
            # Extract the ticker from the file name, get the string up to the 1st '_'
            ticker = file_name.split('_')[0]

            # Append ticker, date, time and headline as a list to the 'parsed_news' list
            parsed_news.append([ticker, date, time, text])

        else:
            # Handle cases where the 'a' tag is not found as desired
            text = "Not found"  # Or any other value or action depending on your needs

parsed_news
[['AAPL',
  'Jul-14-23',
  '08:00AM',
  'Warren Buffetts Favorite Dividend Stocks  Should You Invest?'],
 ['AAPL',
  'Jul-14-23',
  '07:30AM',
  '2 No-Brainer Growth Stocks Up 46% and 63% to Buy Before the Next Bull Market'],
 ['AAPL',
  'Jul-14-23',
  '06:20AM',
  'Amazon has become one the most boring stories in tech: Morning Brief'],
 ['AAPL',
  'Jul-14-23',
  '06:05AM',
  '2 Under-the-Radar Gaming Stocks You Can Buy and Hold for the Next Decade'],
 ['AAPL',
  'Jul-14-23',
  '05:50AM',
  '3 Best Buffett Stocks to Buy for the Long Haul'],
 ['AAPL',
  'Jul-14-23',
  '05:35AM',
  'Got $3,000? 2 Tech Stocks to Buy and Hold for the Long Term'],
 ['AAPL',
  'Jul-14-23',
  '05:26AM',
  'Is This Top Tech Stock About to Become the Next $3 Trillion Company?'],
 ['AAPL', 'Jul-13-23', '07:14PM', 'The 2023 Unhedged stock draft'],
 ['AAPL',
  'Jul-13-23',
  '05:55PM',
  '3 Stocks to Buy for Artificial Intelligence (AI) Exposure'],
 ['AAPL',
  'Jul-13-23',
  '04:29PM',
  "Which Companies Could Buy a Stake in Disney's ESPN?"],
 ['AAPL',
  'Jul-13-23',
  '04:15PM',
  "Hollywood actors strike could be a 'near-term benefit' for streamers: Analyst"],
 ['AAPL',
  'Jul-13-23',
  '01:34PM',
  'Apple Defies Decline As iPhone Market Share Surges Amid Smartphone Slump'],
 ['AAPL',
  'Jul-13-23',
  '11:08AM',
  "Apple's (AAPL) Streaming Service Receives 54 Emmy Nominations"],
 ['AAPL',
  'Jul-13-23',
  '10:31AM',
  'Apples British sales bounce back to record £1.5bn after Covid slump'],
 ['AAPL', 'Jul-13-23', '09:45AM', '2 Stocks to Invest in Virtual Reality'],   ...
##### Perform Sentiment Analysis with Vader
# Instantiate the sentiment intensity analyzer
vader = SentimentIntensityAnalyzer()
# Set column names
columns = ['ticker', 'date', 'time', 'headline']
# Convert the parsed_news list into a DataFrame called 'parsed_and_scored_news'
parsed_and_scored_news = pd.DataFrame(parsed_news, columns=columns)

# Iterate through the headlines and get the polarity scores using vader
scores = parsed_and_scored_news['headline'].apply(vader.polarity_scores).tolist()
# Convert the 'scores' list of dicts into a DataFrame
scores_df = pd.DataFrame(scores)

# Join the DataFrames of the news and the list of dicts
parsed_and_scored_news = parsed_and_scored_news.join(scores_df, rsuffix='_right')
# Convert the date column from string to datetime
parsed_and_scored_news['date'] = pd.to_datetime(parsed_and_scored_news.date).dt.date
parsed_and_scored_news.tail()
Sentiment data
The process involves populating a DataFrame with Parsed news data. Each piece of news is subsequently analyzed to determine whether the sentiment is positive, negative or neutral. A compound score is then computed, which provides an aggregated measure of the sentiment trend.
| ticker | date | time | headline | neg | neu | pos | compound | |
|---|---|---|---|---|---|---|---|---|
| 9995 | XOM | 2023-06-16 | 07:40AM | Oil faces a 'serious problem' by 2024 as produ... | 0.197 | 0.803 | 0.00 | -0.5267 |
| 9996 | XOM | 2023-06-16 | 07:08AM | Inside the race to remake lithium extraction f... | 0.000 | 1.000 | 0.00 | 0.0000 |
| 9997 | XOM | 2023-06-16 | 07:00AM | Investors in Exxon Mobil (NYSE:XOM) have seen ... | 0.000 | 0.820 | 0.18 | 0.5106 |
| 9998 | XOM | 2023-06-16 | 07:00AM | INSIGHT-Inside the race to remake lithium extr... | 0.000 | 1.000 | 0.00 | 0.0000 |
| 9999 | XOM | 2023-06-15 | 07:09PM | Tales of Stock Compounding: Does It Always Work? | 0.000 | 1.000 | 0.00 | 0.0000 |
# Group by each ticker and get the mean of all sentiment scores
mean_scores = parsed_and_scored_news.groupby(['ticker']).mean()
mean_scores
C:\Users\Admin\AppData\Local\Temp\ipykernel_16264\2723772882.py:2: FutureWarning:

The default value of numeric_only in DataFrameGroupBy.mean is deprecated. In a future version, numeric_only will default to False. Either specify numeric_only or select only columns which should be valid for the function.
| neg | neu | pos | compound | |
|---|---|---|---|---|
| ticker | ||||
| AAPL | 0.03496 | 0.84100 | 0.12402 | 0.134145 |
| ABBV | 0.03245 | 0.84974 | 0.11781 | 0.135030 |
| ABT | 0.04561 | 0.86803 | 0.08636 | 0.061686 |
| ACN | 0.02564 | 0.86268 | 0.11168 | 0.143406 |
| ADBE | 0.04316 | 0.87446 | 0.08239 | 0.052778 |
| ... | ... | ... | ... | ... |
| VZ | 0.02482 | 0.86735 | 0.10782 | 0.141956 |
| WBA | 0.09430 | 0.81435 | 0.09136 | 0.019264 |
| WFC | 0.06189 | 0.75951 | 0.17859 | 0.161680 |
| WMT | 0.03938 | 0.80769 | 0.15293 | 0.152200 |
| XOM | 0.04880 | 0.82672 | 0.12449 | 0.118250 |
100 rows × 4 columns
import numpy as np

# Parsing each stocks' price.
industries = []
sectors = []
prices = []
for ticker in tickers:
    tickerdata = yf.Ticker(ticker)
    try:
        prices.append(tickerdata.info['currentPrice'])
    except KeyError:
        prices.append(np.nan)

    try:
        sectors.append(tickerdata.info['sector'])
    except KeyError:
        sectors.append(np.nan)

    try:
        industries.append(tickerdata.info['industry'])
    except KeyError:
        industries.append(np.nan)
# dictionary {'column name': list of values for column} to be converted to dataframe
d = {'Sector': sectors, 'Industry': industries, 'Price': prices}
# create dataframe
df_info = pd.DataFrame(data=d, index=tickers)
df_info
| Sector | Industry | Price | |
|---|---|---|---|
| Symbol | |||
| AAPL | Technology | Consumer Electronics | 190.320 |
| ABBV | Healthcare | Drug Manufacturers—General | 133.835 |
| ABT | Healthcare | Medical Devices | 106.810 |
| ACN | Technology | Information Technology Services | 315.150 |
| ADBE | Technology | Software—Infrastructure | 512.940 |
| ... | ... | ... | ... |
| VZ | Communication Services | Telecom Services | 34.565 |
| WBA | Healthcare | Pharmaceutical Retailers | 29.890 |
| WFC | Financial Services | Banks—Diversified | 43.455 |
| WMT | Consumer Defensive | Discount Stores | 154.430 |
| XOM | Energy | Oil & Gas Integrated | 104.000 |
100 rows × 3 columns
df = mean_scores.join(df_info)
df = df.rename(columns={"compound": "Sentiment Score", "neg": "Negative", "neu": "Neutral", "pos": "Positive"})
df = df.reset_index()
df
Collect data to dataframe
| ticker | Negative | Neutral | Positive | Sentiment Score | Sector | Industry | Price | |
|---|---|---|---|---|---|---|---|---|
| 0 | AAPL | 0.04388 | 0.84774 | 0.10836 | 0.086201 | Technology | Consumer Electronics | 190.320 |
| 1 | ABBV | 0.03000 | 0.84824 | 0.12176 | 0.146174 | Healthcare | Drug Manufacturers—General | 133.835 |
| 2 | ABT | 0.04847 | 0.86294 | 0.08859 | 0.061468 | Healthcare | Medical Devices | 106.810 |
| 3 | ACN | 0.02564 | 0.86268 | 0.11168 | 0.143406 | Technology | Information Technology Services | 315.150 |
| 4 | ADBE | 0.04145 | 0.87230 | 0.08625 | 0.064446 | Technology | Software—Infrastructure | 512.940 |
| ... | ... | ... | ... | ... | ... | ... | ... | ... |
| 95 | VZ | 0.02637 | 0.87088 | 0.10275 | 0.125678 | Communication Services | Telecom Services | 34.565 |
| 96 | WBA | 0.09430 | 0.81435 | 0.09136 | 0.019264 | Healthcare | Pharmaceutical Retailers | 29.890 |
| 97 | WFC | 0.07355 | 0.77450 | 0.15193 | 0.104411 | Financial Services | Banks—Diversified | 43.455 |
| 98 | WMT | 0.04117 | 0.80796 | 0.15086 | 0.147280 | Consumer Defensive | Discount Stores | 154.430 |
| 99 | XOM | 0.05038 | 0.80983 | 0.13980 | 0.137952 | Energy | Oil & Gas Integrated | 104.000 |
100 rows × 8 columns
Treemap
fig = px.treemap(df, path=[px.Constant("Sectors"), 'Sector', 'Industry', 'ticker'],
                  color='Sentiment Score', hover_data=['Price', 'Negative', 'Neutral', 'Positive', 'Sentiment Score'],
                  color_continuous_scale=['#FF0000', "#000000", '#00FF00'],
                  color_continuous_midpoint=0)
fig.data[0].customdata = df[['Price', 'Negative', 'Neutral', 'Positive', 'Sentiment Score']].round(3) # round to 3 decimal places
fig.data[0].texttemplate = "%{label}<br>%{customdata[4]}"
fig.update_traces(textposition="middle center")
fig.update_layout(margin = dict(t=30, l=10, r=10, b=10), font_size=20)

plotly.offline.plot(fig, filename='stock_sentiment.html') # this writes the plot into a html file and opens it
Conclusion
As previously mentioned, you can refer to the hyperlink above to review the sentiment analysis conducted for each stock within the S&P 500. The majority of the anaylzed news sentiments lean towards positivity. This can aid in understanding market trends. However, it is important to note that that this could also lead investors to make misguided decisions.