DCF Valuation & Analysis (TNK)
Stock Valuation using Free Cash Flow to the Firm with Python
[Info] DCF modeling guideline
The detail of the calculations will be skipped, all explaination is in the AAPL DCF modeling.😊
DCF Modeling
- Pull out quarter financial statments
Quarter Balance Sheet
Show hidden code
import yfinance as yf
import pandas as pd
import datetime

ticker = yf.Ticker("TNK")
# - income statement
# pd.set_option('display.max_rows', None)
balance_sheet_df = ticker.quarterly_balance_sheet
balance_sheet_df| 2023-09-30 | 2023-06-30 | 2023-03-31 | 2022-12-31 | 2022-09-30 | |
|---|---|---|---|---|---|
| Ordinary Shares Number | 34079721.0 | 34000000.0 | 33900000.0 | 33938942.0 | 33900000.0 |
| Share Issued | 34079721.0 | 34000000.0 | 33900000.0 | 33938942.0 | 33900000.0 |
| Total Debt | 231344000.0 | 298953000.0 | 451496000.0 | 576203000.0 | 586884000.0 |
| Tangible Book Value | 1418537000.0 | 1345514000.0 | 1236901000.0 | 1066529000.0 | 919113000.0 |
| Invested Capital | NaN | 1348789000.0 | 1240275000.0 | 1070006000.0 | 945073000.0 |
| Working Capital | 334945000.0 | 305165000.0 | 313175000.0 | 289335000.0 | 144205000.0 |
| Net Tangible Assets | 1418537000.0 | 1345514000.0 | 1236901000.0 | 1066529000.0 | 919113000.0 |
| Capital Lease Obligations | 231344000.0 | 298953000.0 | 451496000.0 | 576203000.0 | 564507000.0 |
| Common Stock Equity | 1421715000.0 | 1348789000.0 | 1240275000.0 | 1070006000.0 | 922696000.0 |
| Total Capitalization | 1421715000.0 | 1348789000.0 | 1240275000.0 | 1070006000.0 | 922696000.0 |
| Total Equity Gross Minority Interest | 1421715000.0 | 1348789000.0 | 1240275000.0 | 1070006000.0 | 922696000.0 |
| Stockholders Equity | 1421715000.0 | 1348789000.0 | 1240275000.0 | 1070006000.0 | 922696000.0 |
| Retained Earnings | NaN | 44117000.0 | -64236000.0 | -233604000.0 | -380031000.0 |
| Capital Stock | NaN | 1304672000.0 | 1304511000.0 | 1303610000.0 | 1302727000.0 |
| Common Stock | NaN | 1304672000.0 | 1304511000.0 | 1303610000.0 | 1302727000.0 |
| Total Liabilities Net Minority Interest | 348920000.0 | 431028000.0 | 598605000.0 | 713648000.0 | 709886000.0 |
| Total Non Current Liabilities Net Minority Interest | 218957000.0 | 284787000.0 | 423600000.0 | 543474000.0 | 534668000.0 |
| Other Non Current Liabilities | 47501000.0 | 51681000.0 | 46179000.0 | 44017000.0 | 42485000.0 |
| Long Term Debt And Capital Lease Obligation | 171456000.0 | 233106000.0 | 377421000.0 | 499457000.0 | 492183000.0 |
| Long Term Capital Lease Obligation | 171456000.0 | 233106000.0 | 377421000.0 | 499457000.0 | 492183000.0 |
| Current Liabilities | 129963000.0 | 146241000.0 | 175005000.0 | 170174000.0 | 175218000.0 |
| Other Current Liabilities | 2890000.0 | 7034000.0 | 9135000.0 | 2468000.0 | 1310000.0 |
| Current Debt And Capital Lease Obligation | 59888000.0 | 65847000.0 | 74075000.0 | 76746000.0 | 94701000.0 |
| Current Capital Lease Obligation | 59888000.0 | 65847000.0 | 74075000.0 | 76746000.0 | 72324000.0 |
| Current Debt | NaN | NaN | NaN | NaN | 22377000.0 |
| Other Current Borrowings | NaN | NaN | NaN | NaN | 22377000.0 |
| Line Of Credit | NaN | NaN | NaN | 0.0 | 0.0 |
| Payables And Accrued Expenses | 67185000.0 | 73360000.0 | 91795000.0 | 90960000.0 | 79207000.0 |
| Current Accrued Expenses | NaN | 32695000.0 | 45946000.0 | 47469000.0 | 42864000.0 |
| Interest Payable | NaN | NaN | NaN | 1976000.0 | NaN |
| Payables | 67185000.0 | 40665000.0 | 45849000.0 | 90960000.0 | 36343000.0 |
| Dueto Related Parties Current | 4257000.0 | 3244000.0 | 1915000.0 | 1141000.0 | 1376000.0 |
| Accounts Payable | 62928000.0 | 37421000.0 | 43934000.0 | 89819000.0 | 34967000.0 |
| Total Assets | 1770635000.0 | 1779817000.0 | 1838880000.0 | 1783654000.0 | 1632582000.0 |
| Total Non Current Assets | 1305727000.0 | 1328411000.0 | 1350700000.0 | 1324145000.0 | 1313159000.0 |
| Other Non Current Assets | 6096000.0 | 7139000.0 | 6268000.0 | 8208000.0 | 6927000.0 |
| Financial Assets | NaN | 0.0 | 1092000.0 | 1622000.0 | 2111000.0 |
| Investments And Advances | 15215000.0 | 16549000.0 | 17328000.0 | 16198000.0 | 14490000.0 |
| Long Term Equity Investment | 15215000.0 | 16549000.0 | 17328000.0 | 16198000.0 | 14490000.0 |
| Investmentsin Joint Venturesat Cost | 15215000.0 | 16549000.0 | 17328000.0 | 16198000.0 | 14490000.0 |
| Goodwill And Other Intangible Assets | 3178000.0 | 3275000.0 | 3374000.0 | 3477000.0 | 3583000.0 |
| Other Intangible Assets | 752000.0 | 849000.0 | 948000.0 | 1051000.0 | 1157000.0 |
| Goodwill | 2426000.0 | 2426000.0 | 2426000.0 | 2426000.0 | 2426000.0 |
| Net PPE | 1281238000.0 | 1301448000.0 | 1322638000.0 | 1296262000.0 | 1286048000.0 |
| Accumulated Depreciation | NaN | -507700000.0 | -485600000.0 | -461800000.0 | -441400000.0 |
| Gross PPE | 1281238000.0 | 1809148000.0 | 1808238000.0 | 1296262000.0 | 1727448000.0 |
| Other Properties | 86624000.0 | 90831000.0 | 92691000.0 | 42894000.0 | 16063000.0 |
| Current Assets | 464908000.0 | 451406000.0 | 488180000.0 | 459509000.0 | 319423000.0 |
| Hedging Assets Current | 0.0 | 0.0 | 2033000.0 | 2087000.0 | 2377000.0 |
| Assets Held For Sale Current | NaN | NaN | NaN | 0.0 | 0.0 |
| Restricted Cash | 691000.0 | 703000.0 | 3703000.0 | 3714000.0 | 2730000.0 |
| Prepaid Assets | 10341000.0 | 12833000.0 | 12933000.0 | 10248000.0 | 10506000.0 |
| Inventory | 51678000.0 | 56803000.0 | 64421000.0 | 60832000.0 | 66173000.0 |
| Receivables | 174906000.0 | 202217000.0 | 235339000.0 | 202116000.0 | 159629000.0 |
| Other Receivables | 58406000.0 | 77444000.0 | 80579000.0 | 82923000.0 | 79425000.0 |
| Duefrom Related Parties Current | 66000.0 | 70000.0 | 211000.0 | 2486000.0 | 2519000.0 |
| Accounts Receivable | 116434000.0 | 124703000.0 | 154549000.0 | 116707000.0 | 77685000.0 |
| Allowance For Doubtful Accounts Receivable | NaN | -8200000.0 | -8600000.0 | -6400000.0 | NaN |
| Gross Accounts Receivable | NaN | 132903000.0 | 163149000.0 | 123107000.0 | NaN |
| Cash Cash Equivalents And Short Term Investments | 227292000.0 | 178850000.0 | 169751000.0 | 180512000.0 | 78008000.0 |
| Cash And Cash Equivalents | 227292000.0 | 178850000.0 | 169751000.0 | 180512000.0 | 78008000.0 |
Quarter Cash Flow
Show hidden code
cash_flow_df = ticker.quarterly_cashflow
cash_flow_df| 2023-09-30 | 2023-06-30 | 2023-03-31 | 2022-12-31 | 2022-09-30 | |
|---|---|---|---|---|---|
| Free Cash Flow | 120229000.0 | 200634000.0 | 166877000.0 | 141174000.0 | 42223000.0 |
| Repayment Of Debt | -64417000.0 | -177035000.0 | -202649000.0 | -37646000.0 | -115369000.0 |
| Issuance Of Debt | 0.0 | 26000000.0 | 25000000.0 | 0.0 | 59989000.0 |
| Capital Expenditure | -3275000.0 | -2258000.0 | -442000.0 | -3919000.0 | -4097000.0 |
| End Cash Position | 227983000.0 | 179553000.0 | 176589000.0 | 187361000.0 | 83873000.0 |
| Beginning Cash Position | 179553000.0 | 176589000.0 | 187361000.0 | 83873000.0 | 71904000.0 |
| Changes In Cash | 48430000.0 | 2964000.0 | -10772000.0 | 103488000.0 | 11969000.0 |
| Financing Cash Flow | -73799000.0 | -199570000.0 | -177649000.0 | -37686000.0 | -55380000.0 |
| Cash Flow From Continuing Financing Activities | -73799000.0 | -199570000.0 | -177649000.0 | -37686000.0 | -55380000.0 |
| Net Other Financing Charges | -866000.0 | NaN | NaN | -40000.0 | 0.0 |
| Cash Dividends Paid | -8516000.0 | NaN | NaN | NaN | NaN |
| Net Issuance Payments Of Debt | -64417000.0 | -151035000.0 | -177649000.0 | -37646000.0 | -55380000.0 |
| Net Short Term Debt Issuance | 0.0 | 0.0 | 0.0 | 0.0 | -15000000.0 |
| Short Term Debt Payments | 0.0 | -25000000.0 | -25000000.0 | 0.0 | -75000000.0 |
| Short Term Debt Issuance | 0.0 | 25000000.0 | 25000000.0 | 0.0 | 60000000.0 |
| Net Long Term Debt Issuance | -64417000.0 | -151035000.0 | -177649000.0 | -37646000.0 | -40380000.0 |
| Long Term Debt Payments | -64417000.0 | -152035000.0 | -177649000.0 | -37646000.0 | -40369000.0 |
| Long Term Debt Issuance | 0.0 | 1000000.0 | 0.0 | 0.0 | -11000.0 |
| Investing Cash Flow | -1275000.0 | -358000.0 | -442000.0 | -3919000.0 | 21029000.0 |
| Cash Flow From Continuing Investing Activities | -1275000.0 | -358000.0 | -442000.0 | -3919000.0 | 21029000.0 |
| Net Other Investing Changes | 2000000.0 | NaN | NaN | 69646000.0 | 0.0 |
| Net PPE Purchase And Sale | 0.0 | 0.0 | 0.0 | 0.0 | 25126000.0 |
| Sale Of PPE | 0.0 | 0.0 | 0.0 | 0.0 | 25126000.0 |
| Capital Expenditure Reported | -3275000.0 | -2258000.0 | -442000.0 | -3919000.0 | -4097000.0 |
| Operating Cash Flow | 123504000.0 | 202892000.0 | 167319000.0 | 145093000.0 | 46320000.0 |
| Cash Flow From Continuing Operating Activities | 123504000.0 | 202892000.0 | 167319000.0 | 145093000.0 | 46320000.0 |
| Change In Working Capital | 23596000.0 | 19001000.0 | -28946000.0 | -25152000.0 | -29036000.0 |
| Other Non Cash Items | -2279000.0 | -1604000.0 | 1687000.0 | -539000.0 | -8348000.0 |
| Asset Impairment Charge | NaN | NaN | 0.0 | NaN | NaN |
| Deferred Tax | -3078000.0 | 7863000.0 | 1781000.0 | 985000.0 | 903000.0 |
| Deferred Income Tax | -3078000.0 | 7863000.0 | 1781000.0 | 985000.0 | 903000.0 |
| Depreciation Amortization Depletion | 24565000.0 | 24384000.0 | 23975000.0 | 24459000.0 | 24251000.0 |
| Depreciation And Amortization | 24565000.0 | 24384000.0 | 23975000.0 | 24459000.0 | 24251000.0 |
| Operating Gains Losses | -666000.0 | 2005000.0 | -546000.0 | -1087000.0 | -9503000.0 |
| Earnings Losses From Equity Investments | -666000.0 | -1120000.0 | -1130000.0 | -1708000.0 | -221000.0 |
| Gain Loss On Investment Securities | 0.0 | 3125000.0 | 584000.0 | 621000.0 | -1126000.0 |
| Net Income From Continuing Operations | 81366000.0 | 151243000.0 | 169368000.0 | 146427000.0 | 68053000.0 |
Quarter Income Statement
Show hidden code
income_statement_df = ticker.quarterly_income_stmt
income_statement_df| 2023-09-30 | 2023-06-30 | 2023-03-31 | 2022-12-31 | 2022-09-30 | |
|---|---|---|---|---|---|
| Tax Effect Of Unusual Items | 0.0 | 138353.172611 | -17894.389747 | -5063.721764 | 219180.93562 |
| Tax Rate For Calcs | 0.21 | 0.050959 | 0.013294 | 0.006116 | 0.01832 |
| Normalized EBITDA | 109843000.0 | 186940000.0 | 208189000.0 | 157822000.0 | 90634000.0 |
| Total Unusual Items | 0.0 | 2715000.0 | -1346000.0 | -828000.0 | 11964000.0 |
| Total Unusual Items Excluding Goodwill | 0.0 | 2715000.0 | -1346000.0 | -828000.0 | 11964000.0 |
| Net Income From Continuing Operation Net Minority Interest | 81366000.0 | 151243000.0 | 169368000.0 | 146427000.0 | 68053000.0 |
| Reconciled Depreciation | 24565000.0 | 24384000.0 | 23975000.0 | 24459000.0 | 24251000.0 |
| Reconciled Cost Of Revenue | 193583000.0 | 198957000.0 | 199289000.0 | 200692000.0 | 202483000.0 |
| EBITDA | 109843000.0 | 189655000.0 | 206843000.0 | 156994000.0 | 102598000.0 |
| EBIT | 85278000.0 | 165271000.0 | 182868000.0 | 156994000.0 | 78347000.0 |
| Net Interest Income | -3321000.0 | -4136000.0 | -8988000.0 | -8746000.0 | -8808000.0 |
| Interest Expense | 6440000.0 | 5907000.0 | 11218000.0 | 9666000.0 | 9024000.0 |
| Interest Income | 3119000.0 | 1771000.0 | 2230000.0 | 920000.0 | 216000.0 |
| Normalized Income | 81366000.0 | 148666353.172611 | 170696105.610253 | 147249936.278236 | 56308180.93562 |
| Net Income From Continuing And Discontinued Operation | 81366000.0 | 151243000.0 | 169368000.0 | 146427000.0 | 68053000.0 |
| Total Expenses | 204283000.0 | 211075000.0 | 211558000.0 | 211634000.0 | 212170000.0 |
| Rent Expense Supplemental | 19378000.0 | 18691000.0 | 12945000.0 | 8035000.0 | 7236000.0 |
| Total Operating Income As Reported | 81575000.0 | 159571000.0 | 181851000.0 | 154275000.0 | 75372000.0 |
| Diluted Average Shares | 34571439.0 | 34546749.0 | 34540269.0 | 34491486.0 | 34374752.0 |
| Basic Average Shares | 34201415.0 | 34140540.0 | 34092504.0 | 34081220.0 | 34039501.0 |
| Diluted EPS | 2.35 | 4.38 | 4.9 | 4.25 | 1.98 |
| Basic EPS | 2.38 | 4.43 | 4.97 | 4.3 | 2.0 |
| Diluted NI Availto Com Stockholders | 81366000.0 | 151243000.0 | 169368000.0 | 146427000.0 | 68053000.0 |
| Net Income Common Stockholders | 81366000.0 | 151243000.0 | 169368000.0 | 146427000.0 | 68053000.0 |
| Net Income | 81366000.0 | 151243000.0 | 169368000.0 | 146427000.0 | 68053000.0 |
| Net Income Including Noncontrolling Interests | 81366000.0 | 151243000.0 | 169368000.0 | 146427000.0 | 68053000.0 |
| Net Income Continuous Operations | 81366000.0 | 151243000.0 | 169368000.0 | 146427000.0 | 68053000.0 |
| Tax Provision | -2528000.0 | 8121000.0 | 2282000.0 | 901000.0 | 1270000.0 |
| Pretax Income | 78838000.0 | 159364000.0 | 171650000.0 | 147328000.0 | 69323000.0 |
| Other Income Expense | 584000.0 | 3929000.0 | -2461000.0 | 390000.0 | 10915000.0 |
| Other Non Operating Income Expenses | -82000.0 | 94000.0 | -2245000.0 | -490000.0 | -1270000.0 |
| Special Income Charges | 0.0 | 0.0 | -1248000.0 | -1409000.0 | 8156000.0 |
| Gain On Sale Of Ppe | 0.0 | 0.0 | NaN | NaN | 8156000.0 |
| Impairment Of Capital Assets | NaN | NaN | 0.0 | 0.0 | NaN |
| Restructuring And Mergern Acquisition | 0.0 | 0.0 | 1248000.0 | 1409000.0 | 0.0 |
| Earnings From Equity Interest | 666000.0 | 1120000.0 | 1130000.0 | 1708000.0 | 221000.0 |
| Gain On Sale Of Security | NaN | 2715000.0 | -98000.0 | 581000.0 | 3808000.0 |
| Net Non Operating Interest Income Expense | -3321000.0 | -4136000.0 | -8988000.0 | -8746000.0 | -8808000.0 |
| Interest Expense Non Operating | 6440000.0 | 5907000.0 | 11218000.0 | 9666000.0 | 9024000.0 |
| Interest Income Non Operating | 3119000.0 | 1771000.0 | 2230000.0 | 920000.0 | 216000.0 |
| Operating Income | 81575000.0 | 159571000.0 | 183099000.0 | 155684000.0 | 67216000.0 |
| Operating Expense | 10700000.0 | 12118000.0 | 12269000.0 | 10942000.0 | 9687000.0 |
| Selling General And Administration | 10700000.0 | 12118000.0 | 12269000.0 | 10942000.0 | 9687000.0 |
| General And Administrative Expense | 10700000.0 | 12118000.0 | 12269000.0 | 10942000.0 | 9687000.0 |
| Other Gand A | 10700000.0 | 12118000.0 | 12269000.0 | 10942000.0 | 9687000.0 |
| Gross Profit | 92275000.0 | 171689000.0 | 195368000.0 | 166626000.0 | 76903000.0 |
| Cost Of Revenue | 193583000.0 | 198957000.0 | 199289000.0 | 200692000.0 | 202483000.0 |
| Total Revenue | 285858000.0 | 370646000.0 | 394657000.0 | 367318000.0 | 279386000.0 |
| Operating Revenue | 282893000.0 | 367961000.0 | 391754000.0 | 365055000.0 | 277737000.0 |
Annual Income Statement
Show hidden code
annual_income = ticker.income_stmt
annual_income| 2022-12-31 | 2021-12-31 | 2020-12-31 | 2019-12-31 | |
|---|---|---|---|---|
| Tax Effect Of Unusual Items | 28210.722296 | -725629.746667 | -5625001.183932 | -1757970.0 |
| Tax Rate For Calcs | 0.002304 | 0.007904 | 0.076987 | 0.27 |
| Normalized EBITDA | 352143000.0 | -11384000.0 | 336401000.0 | 237237000.0 |
| Total Unusual Items | 12245000.0 | -91804000.0 | -73064000.0 | -6511000.0 |
| Total Unusual Items Excluding Goodwill | 12245000.0 | -91804000.0 | -73064000.0 | -6511000.0 |
| Net Income From Continuing Operation Net Minority Interest | 229086000.0 | -242372000.0 | 87317000.0 | 41362000.0 |
| Reconciled Depreciation | 99033000.0 | 106084000.0 | 117212000.0 | 124002000.0 |
| Reconciled Cost Of Revenue | 772459000.0 | 600379000.0 | 635011000.0 | 756356000.0 |
| EBITDA | 364388000.0 | -103188000.0 | 263337000.0 | 230726000.0 |
| EBIT | 265355000.0 | -209272000.0 | 146125000.0 | 106724000.0 |
| Net Interest Income | -34402000.0 | -34909000.0 | -50326000.0 | -64491000.0 |
| Interest Expense | 35740000.0 | 35031000.0 | 51525000.0 | 65362000.0 |
| Interest Income | 1338000.0 | 122000.0 | 1199000.0 | 871000.0 |
| Normalized Income | 216869210.722296 | -151293629.746667 | 154755998.816068 | 46115030.0 |
| Net Income From Continuing And Discontinued Operation | 229086000.0 | -242372000.0 | 87317000.0 | 41362000.0 |
| Total Expenses | 814228000.0 | 644094000.0 | 674017000.0 | 811643000.0 |
| Rent Expense Supplemental | 27374000.0 | 13799000.0 | 36341000.0 | 43189000.0 |
| Total Operating Income As Reported | 255949000.0 | -194095000.0 | 141573000.0 | 122663000.0 |
| Diluted Average Shares | 34287075.0 | 33859306.0 | 33921621.0 | 33731171.0 |
| Basic Average Shares | 33997579.0 | 33859306.0 | 33718665.0 | 33617635.0 |
| Diluted EPS | 6.68 | -7.16 | 2.57 | 1.23 |
| Basic EPS | 6.74 | -7.16 | 2.59 | 1.23 |
| Diluted NI Availto Com Stockholders | 229086000.0 | -242372000.0 | 87317000.0 | 41362000.0 |
| Net Income Common Stockholders | 229086000.0 | -242372000.0 | 87317000.0 | 41362000.0 |
| Net Income | 229086000.0 | -242372000.0 | 87317000.0 | 41362000.0 |
| Net Income Including Noncontrolling Interests | 229086000.0 | -242372000.0 | 87317000.0 | 41362000.0 |
| Net Income Continuous Operations | 229086000.0 | -242372000.0 | 87317000.0 | 41362000.0 |
| Tax Provision | 529000.0 | -1931000.0 | 7283000.0 | 20103000.0 |
| Pretax Income | 229615000.0 | -244303000.0 | 94600000.0 | 41362000.0 |
| Other Income Expense | 15134000.0 | -107667000.0 | -67491000.0 | -3471000.0 |
| Other Non Operating Income Expenses | 2645000.0 | -1756000.0 | 473000.0 | 695000.0 |
| Special Income Charges | 7066000.0 | -92368000.0 | -70844000.0 | -5544000.0 |
| Impairment Of Capital Assets | -8888000.0 | 92368000.0 | 69446000.0 | 5544000.0 |
| Restructuring And Mergern Acquisition | 1822000.0 | 0.0 | 1398000.0 | 0.0 |
| Earnings From Equity Interest | 244000.0 | -14107000.0 | 5100000.0 | 2345000.0 |
| Gain On Sale Of Security | 5179000.0 | 564000.0 | -2220000.0 | -967000.0 |
| Net Non Operating Interest Income Expense | -34402000.0 | -34909000.0 | -50326000.0 | -64491000.0 |
| Interest Expense Non Operating | 35740000.0 | 35031000.0 | 51525000.0 | 65362000.0 |
| Interest Income Non Operating | 1338000.0 | 122000.0 | 1199000.0 | 871000.0 |
| Operating Income | 248883000.0 | -101727000.0 | 212417000.0 | 109324000.0 |
| Operating Expense | 41769000.0 | 43715000.0 | 39006000.0 | 55287000.0 |
| Other Taxes | NaN | NaN | NaN | 18883000.0 |
| Selling General And Administration | 41769000.0 | 43715000.0 | 39006000.0 | 36404000.0 |
| General And Administrative Expense | 41769000.0 | 43715000.0 | 39006000.0 | 36404000.0 |
| Other Gand A | 41769000.0 | 43715000.0 | 39006000.0 | 36404000.0 |
| Gross Profit | 290652000.0 | -58012000.0 | 251423000.0 | 164611000.0 |
| Cost Of Revenue | 772459000.0 | 600379000.0 | 635011000.0 | 756356000.0 |
| Total Revenue | 1063111000.0 | 542367000.0 | 886434000.0 | 920967000.0 |
| Operating Revenue | 1054000000.0 | 532055000.0 | 869402000.0 | 877368000.0 |
Annual Cash Flow
Show hidden code
annual_cash_flow = ticker.cashflow
annual_cash_flow| 2022-12-31 | 2021-12-31 | 2020-12-31 | 2019-12-31 | |
|---|---|---|---|---|
| Free Cash Flow | 177835000.0 | -130889000.0 | 331918000.0 | 106033000.0 |
| Repayment Of Debt | -534142000.0 | -387087000.0 | -1195818000.0 | -410438000.0 |
| Issuance Of Debt | 422108000.0 | 411393000.0 | 809872000.0 | 320806000.0 |
| Issuance Of Capital Stock | NaN | NaN | NaN | 0.0 |
| Capital Expenditure | -15430000.0 | -21447000.0 | -16025000.0 | -11628000.0 |
| End Cash Position | 187361000.0 | 55928000.0 | 103146000.0 | 96790000.0 |
| Beginning Cash Position | 55928000.0 | 103146000.0 | 96790000.0 | 60507000.0 |
| Changes In Cash | 131433000.0 | -47218000.0 | 6356000.0 | 36283000.0 |
| Financing Cash Flow | -113048000.0 | 24081000.0 | -416104000.0 | -89758000.0 |
| Cash Flow From Continuing Financing Activities | -113048000.0 | 24081000.0 | -416104000.0 | -89758000.0 |
| Net Other Financing Charges | -1014000.0 | -225000.0 | -30158000.0 | -126000.0 |
| Cash Dividends Paid | NaN | NaN | NaN | 0.0 |
| Common Stock Dividend Paid | NaN | NaN | NaN | 0.0 |
| Net Common Stock Issuance | NaN | NaN | NaN | 0.0 |
| Common Stock Issuance | NaN | NaN | NaN | 0.0 |
| Net Issuance Payments Of Debt | -112034000.0 | 24306000.0 | -385946000.0 | -89632000.0 |
| Net Short Term Debt Issuance | -25000000.0 | 15000000.0 | -40000000.0 | 50000000.0 |
| Short Term Debt Payments | -159000000.0 | -35000000.0 | -275000000.0 | -150000000.0 |
| Short Term Debt Issuance | 134000000.0 | 50000000.0 | 235000000.0 | 200000000.0 |
| Net Long Term Debt Issuance | -87034000.0 | 9306000.0 | -345946000.0 | -139632000.0 |
| Long Term Debt Payments | -375142000.0 | -352087000.0 | -920818000.0 | -260438000.0 |
| Long Term Debt Issuance | 288108000.0 | 361393000.0 | 574872000.0 | 120806000.0 |
| Investing Cash Flow | 51216000.0 | 38143000.0 | 74517000.0 | 8380000.0 |
| Cash Flow From Continuing Investing Activities | 51216000.0 | 38143000.0 | 74517000.0 | 8380000.0 |
| Net Other Investing Changes | 66646000.0 | 59590000.0 | 4650000.0 | NaN |
| Net Business Purchase And Sale | NaN | NaN | NaN | 0.0 |
| Sale Of Business | NaN | NaN | NaN | 0.0 |
| Net PPE Purchase And Sale | 69646000.0 | -21447000.0 | 85892000.0 | 20008000.0 |
| Sale Of PPE | 69646000.0 | 58090000.0 | 85892000.0 | 20008000.0 |
| Purchase Of PPE | NaN | -21447000.0 | -16025000.0 | -11628000.0 |
| Capital Expenditure Reported | -15430000.0 | -21447000.0 | -16025000.0 | -11628000.0 |
| Operating Cash Flow | 193265000.0 | -109442000.0 | 347943000.0 | 117661000.0 |
| Cash Flow From Continuing Operating Activities | 193265000.0 | -109442000.0 | 347943000.0 | 117661000.0 |
| Change In Working Capital | -112224000.0 | -50116000.0 | 89920000.0 | -30038000.0 |
| Change In Other Working Capital | 651000.0 | -2039000.0 | -10941000.0 | 7091000.0 |
| Change In Payables And Accrued Expense | 11262000.0 | -6113000.0 | -49056000.0 | 66813000.0 |
| Change In Payable | 11262000.0 | -6113000.0 | -49056000.0 | 66813000.0 |
| Change In Account Payable | 21065000.0 | -13934000.0 | -50040000.0 | 83244000.0 |
| Change In Prepaid Assets | -25000.0 | -484000.0 | 532000.0 | 119000.0 |
| Change In Inventory | -11804000.0 | -17619000.0 | 13634000.0 | -28628000.0 |
| Change In Receivables | -112308000.0 | -21730000.0 | 135751000.0 | -75827000.0 |
| Changes In Account Receivables | -114042000.0 | -22746000.0 | 140290000.0 | -114793000.0 |
| Other Non Cash Items | -10206000.0 | -24972000.0 | -19423000.0 | -26111000.0 |
| Asset Impairment Charge | -8888000.0 | 92368000.0 | 69446000.0 | NaN |
| Deferred Tax | -129000.0 | -3109000.0 | 7113000.0 | 18489000.0 |
| Deferred Income Tax | -129000.0 | -3109000.0 | 7113000.0 | 18489000.0 |
| Depreciation Amortization Depletion | 99033000.0 | 106084000.0 | 117212000.0 | 124002000.0 |
| Depreciation And Amortization | 99033000.0 | 106084000.0 | 117212000.0 | 124002000.0 |
| Operating Gains Losses | -12295000.0 | 12675000.0 | -3642000.0 | 8446000.0 |
| Earnings Losses From Equity Investments | -244000.0 | 14107000.0 | -5100000.0 | -2345000.0 |
| Gain Loss On Investment Securities | -3163000.0 | -1432000.0 | 1458000.0 | 5247000.0 |
| Gain Loss On Sale Of PPE | NaN | NaN | NaN | 5544000.0 |
| Net Income From Continuing Operations | 229086000.0 | -242372000.0 | 87317000.0 | 41362000.0 |
Annual Balance Sheet
Show hidden code
annual_balance_sheet = ticker.balance_sheet
annual_balance_sheet = annual_balance_sheet.fillna(0)
annual_balance_sheet| 2022-12-31 | 2021-12-31 | 2020-12-31 | 2019-12-31 | |
|---|---|---|---|---|
| Ordinary Shares Number | 3.393894e+07 | 3.378851e+07 | 3.373814e+07 | 3.365458e+07 |
| Share Issued | 3.393894e+07 | 3.378851e+07 | 3.373814e+07 | 3.365458e+07 |
| Net Debt | 0.000000e+00 | 2.947190e+08 | 1.557290e+08 | 5.208550e+08 |
| Total Debt | 5.762030e+08 | 6.540290e+08 | 6.170040e+08 | 1.044027e+09 |
| Tangible Book Value | 1.066529e+09 | 8.344920e+08 | 1.074487e+09 | 9.849490e+08 |
| Invested Capital | 1.070006e+09 | 3.452910e+08 | 2.529610e+08 | 6.096790e+08 |
| Working Capital | 2.893350e+08 | 8.830700e+07 | 4.828900e+07 | 1.415200e+08 |
| Net Tangible Assets | 1.066529e+09 | 8.344920e+08 | 1.074487e+09 | 9.849490e+08 |
| Capital Lease Obligations | 5.762030e+08 | 3.087380e+08 | 3.640430e+08 | 4.343480e+08 |
| Common Stock Equity | 1.070006e+09 | 8.384120e+08 | 1.078902e+09 | 9.899200e+08 |
| Total Capitalization | 1.070006e+09 | 1.143203e+09 | 1.311005e+09 | 1.506026e+09 |
| Total Equity Gross Minority Interest | 1.070006e+09 | 8.384120e+08 | 1.078902e+09 | 9.899200e+08 |
| Stockholders Equity | 1.070006e+09 | 8.384120e+08 | 1.078902e+09 | 9.899200e+08 |
| Retained Earnings | -2.336040e+08 | -4.626900e+08 | -2.203180e+08 | -3.076350e+08 |
| Capital Stock | 1.303610e+09 | 1.301102e+09 | 1.299220e+09 | 1.297555e+09 |
| Common Stock | 1.303610e+09 | 1.301102e+09 | 1.299220e+09 | 1.297555e+09 |
| Total Liabilities Net Minority Interest | 7.136480e+08 | 7.803370e+08 | 7.613430e+08 | 1.248136e+09 |
| Total Non Current Liabilities Net Minority Interest | 5.434740e+08 | 6.232490e+08 | 5.642240e+08 | 9.598510e+08 |
| Other Non Current Liabilities | 4.401700e+07 | 4.614100e+07 | 4.964200e+07 | 5.104400e+07 |
| Derivative Product Liabilities | 0.000000e+00 | 0.000000e+00 | 5.970000e+05 | 0.000000e+00 |
| Long Term Debt And Capital Lease Obligation | 4.994570e+08 | 5.771080e+08 | 5.139850e+08 | 9.088070e+08 |
| Long Term Capital Lease Obligation | 4.994570e+08 | 2.723170e+08 | 2.818820e+08 | 3.927010e+08 |
| Long Term Debt | 0.000000e+00 | 3.047910e+08 | 2.321030e+08 | 5.161060e+08 |
| Current Liabilities | 1.701740e+08 | 1.570880e+08 | 1.971190e+08 | 2.882850e+08 |
| Other Current Liabilities | 2.468000e+06 | 1.808000e+06 | 4.863000e+06 | 1.163300e+07 |
| Current Debt And Capital Lease Obligation | 7.674600e+07 | 7.692100e+07 | 1.030190e+08 | 1.352200e+08 |
| Current Capital Lease Obligation | 7.674600e+07 | 3.642100e+07 | 8.216100e+07 | 4.164700e+07 |
| Current Debt | 0.000000e+00 | 4.050000e+07 | 2.085800e+07 | 9.357300e+07 |
| Other Current Borrowings | 0.000000e+00 | 4.050000e+07 | 2.085800e+07 | 9.357300e+07 |
| Line Of Credit | 0.000000e+00 | 2.500000e+07 | 0.000000e+00 | 5.000000e+07 |
| Payables And Accrued Expenses | 9.096000e+07 | 7.835900e+07 | 8.923700e+07 | 1.414320e+08 |
| Current Accrued Expenses | 4.746900e+07 | 3.258300e+07 | 5.505500e+07 | 5.973500e+07 |
| Interest Payable | 1.976000e+06 | 1.951000e+06 | 2.814000e+06 | 2.610000e+06 |
| Payables | 9.096000e+07 | 7.835900e+07 | 8.923700e+07 | 1.414320e+08 |
| Dueto Related Parties Current | 1.141000e+06 | 1.094400e+07 | 3.123000e+06 | 2.139000e+06 |
| Accounts Payable | 8.981900e+07 | 6.741500e+07 | 8.611400e+07 | 1.392930e+08 |
| Total Assets | 1.783654e+09 | 1.618749e+09 | 1.840245e+09 | 2.238056e+09 |
| Total Non Current Assets | 1.324145e+09 | 1.373354e+09 | 1.594837e+09 | 1.808251e+09 |
| Other Non Current Assets | 8.208000e+06 | 5.225000e+06 | 4.032000e+06 | 5.360000e+06 |
| Financial Assets | 1.622000e+06 | 6.680000e+05 | 0.000000e+00 | 8.200000e+04 |
| Investments And Advances | 1.619800e+07 | 1.295400e+07 | 2.856100e+07 | 2.811200e+07 |
| Long Term Equity Investment | 1.619800e+07 | 1.295400e+07 | 2.856100e+07 | 2.811200e+07 |
| Investmentsin Joint Venturesat Cost | 1.619800e+07 | 1.295400e+07 | 2.856100e+07 | 2.811200e+07 |
| Goodwill And Other Intangible Assets | 3.477000e+06 | 3.920000e+06 | 4.415000e+06 | 4.971000e+06 |
| Other Intangible Assets | 1.051000e+06 | 1.494000e+06 | 1.989000e+06 | 2.545000e+06 |
| Goodwill | 2.426000e+06 | 2.426000e+06 | 2.426000e+06 | 2.426000e+06 |
| Net PPE | 1.296262e+09 | 1.351255e+09 | 1.557829e+09 | 1.769726e+09 |
| Accumulated Depreciation | -4.618000e+08 | -3.848000e+08 | -5.418000e+08 | -6.808000e+08 |
| Gross PPE | 1.296262e+09 | 1.351255e+09 | 1.557829e+09 | 1.769726e+09 |
| Other Properties | 4.289400e+07 | 1.425700e+07 | 2.529000e+06 | 1.956000e+07 |
| Current Assets | 4.595090e+08 | 2.453950e+08 | 2.454080e+08 | 4.298050e+08 |
| Hedging Assets Current | 2.087000e+06 | 0.000000e+00 | 0.000000e+00 | 5.770000e+05 |
| Assets Held For Sale Current | 0.000000e+00 | 4.354300e+07 | 3.297400e+07 | 6.545800e+07 |
| Restricted Cash | 3.714000e+06 | 2.221000e+06 | 2.779000e+06 | 3.071000e+06 |
| Prepaid Assets | 1.024800e+07 | 1.022300e+07 | 9.739000e+06 | 1.028800e+07 |
| Inventory | 6.083200e+07 | 4.902800e+07 | 3.460600e+07 | 4.979000e+07 |
| Receivables | 2.021160e+08 | 8.980800e+07 | 6.807800e+07 | 2.117970e+08 |
| Other Receivables | 8.292300e+07 | 4.450300e+07 | 2.664000e+07 | 1.068720e+08 |
| Duefrom Related Parties Current | 2.486000e+06 | 4.220000e+06 | 5.236000e+06 | 6.970000e+05 |
| Accounts Receivable | 1.167070e+08 | 4.108500e+07 | 3.620200e+07 | 1.042280e+08 |
| Allowance For Doubtful Accounts Receivable | -6.400000e+06 | 0.000000e+00 | 0.000000e+00 | 0.000000e+00 |
| Gross Accounts Receivable | 1.231070e+08 | 0.000000e+00 | 0.000000e+00 | 0.000000e+00 |
| Cash Cash Equivalents And Short Term Investments | 1.805120e+08 | 5.057200e+07 | 9.723200e+07 | 8.882400e+07 |
| Cash And Cash Equivalents | 1.805120e+08 | 5.057200e+07 | 9.723200e+07 | 8.882400e+07 |
- FCFF Calculation
Show hidden code
# FCFF Calculation using Cash Flow Statement and Income Statement Inputs
free_cash_flow_firm = (cash_flow_df.loc['Free Cash Flow'].astype(int)) \
                    + (income_statement_df.loc['Interest Expense'].astype(int) \
                        * (1 - income_statement_df.loc['Tax Provision'].astype(int) \
                           / income_statement_df.loc['Pretax Income'].astype(int))).astype(int)

# Change Series to a Pandas Dataframe
free_cash_flow_firm_df = free_cash_flow_firm.to_frame().transpose()
print(free_cashflow_firm_df)
2023-09-30 2023-06-30 2023-03-31 2022-12-31 2022-09-30
0 126875503 206239986 177945862 150780886 51081679
- FCFF CAGR
Show hidden code
# CAGR of FCFF
latest_free_cash_flow_firm = float(free_cash_flow_firm_df.iloc[0,0])
earliest_free_cash_flow_firm = float(free_cash_flow_firm_df.iloc[0,len(free_cash_flow_firm_df.columns)-1])
free_cash_flow_firm_CAGR = ((latest_free_cash_flow_firm/earliest_free_cash_flow_firm)\
                            **(float(1/(len(free_cash_flow_firm_df.columns)))))-1

print(free_cash_flow_firm_CAGR)
FCFF CAGR: 0.19956151126544364
- Long term growth rate
Show hidden code
long_term_growth = free_cash_flow_firm_CAGR / 6
long_term_growth
Long Term Growth Rate: 0.03326025187757394
- Forecast FCFF with 5 quarters
Show hidden code
# Forecasted FCFF
forecast_free_cash_flow_firm_df = pd.DataFrame(columns=['Year ' + str(i) for i in range(1,6)])
free_cash_flow_firm_forecast_lst = []
for i in range(1,6):
    if i != 5:
        free_cash_flow_firm_forecast = latest_free_cash_flow_firm*(1+free_cash_flow_firm_CAGR)**i
    else:
        free_cash_flow_firm_forecast = latest_free_cash_flow_firm*(1+free_cash_flow_firm_CAGR)\
                                        **(i-1)*(1+long_term_growth)
    free_cash_flow_firm_forecast_lst.append(int(free_cash_flow_firm_forecast))
forecast_free_cash_flow_firm_df.loc[0] = free_cash_flow_firm_forecast_lst
forecast_free_cash_flow_firm_df| Quarter 1 | Quarter 2 | Quarter 3 | Quarter 4 | Quarter 5 | |
|---|---|---|---|---|---|
| 0 | 152194970 | 182567228 | 219000620 | 262704715 | 271442340 |
- Risk-Free Rate
Show hidden code
# Risk-free Rate
timespan = 100
current_date = datetime.date.today()
formatted_date = current_date.strftime('%Y-%m-%d')
past_date = current_date-datetime.timedelta(days=timespan)
formatted_past_date = past_date.strftime('%Y-%m-%d')
tk = yf.Ticker('^TNX')
risk_free_rate_df = tk.history(period='3mo')
risk_free_rate = (risk_free_rate_df.iloc[len(risk_free_rate_df)-1,3])/100
risk_free_rate
Risk-Free Rate: 0.0422599983215332
- Fundament stats
Show hidden code
from finvizfinance.quote import finvizfinance
ticker2 = finvizfinance('TNK')
tk = ticker2.ticker_fundament()
tk
{'Company': 'Teekay Tankers Ltd',
'Section': 'Energy',
'Industry': 'Oil & Gas Midstream',
'Country': 'Bermuda',
'Exchange': 'NYSE',
'Index': 'RUT',
'P/E': '3.20',
'EPS (ttm)': '15.88',
'Insider Own': '30.25%',
'Shs Outstand': '29.30M',
'Perf Week': '-2.31%',
'Market Cap': '1.73B',
'Forward P/E': '4.82',
'EPS next Y': '10.54',
'Insider Trans': '0.00%',
'Shs Float': '23.76M',
'Perf Month': '-1.21%',
'Income': '548.40M',
'PEG': '1.07',
'EPS next Q': '3.61',
'Inst Own': '49.63%',
'Short Float / Ratio': '2.32% / 1.31',
'Perf Quarter': '23.19%',
'Sales': '1.42B',
'P/S': '1.22',
'EPS this Y': '139.99%',
'Inst Trans': '29.95%',
'Short Interest': '0.55M',
'Perf Half Y': '34.40%',
'Book/sh': '41.72',
'P/B': '1.22',
'EPS next Y Percentage': '-31.28%',
'ROA': '32.23%',
'Target Price': '64.14',
'Perf Year': '54.39%',
'Cash/sh': '6.69',
'P/C': '7.59',
'EPS next 5Y': '3.00%',
'ROE': '46.78%',
'52W Range From': '25.74',
'52W Range To': '54.11',
'Perf YTD': '69.07%',
'Dividend': '2.12',
'P/FCF': '2.75',
'EPS past 5Y': '-',
'ROI': '34.42%',
'52W High': '-6.14%',
'Beta': '-0.08',
'Dividend %': '4.18%',
'Quick Ratio': '3.18',
'Sales past 5Y': '30.55%',
'Gross Margin': '44.13%',
'52W Low': '97.31%',
'ATR': '1.74',
'Employees': '1750',
'Current Ratio': '3.58',
'Sales Q/Q': '2.32%',
'Oper. Margin': '40.88%',
'RSI (14)': '55.12',
'Volatility W': '3.53%',
'Volatility M': '3.74%',
'Optionable': 'Yes',
'Debt/Eq': '0.16',
'EPS Q/Q': '18.70%',
'Profit Margin': '38.66%',
'Rel Volume': '0.98',
'Prev Close': '49.69',
'Shortable': 'Yes',
'LT Debt/Eq': '0.12',
'Earnings': 'Nov 02 BMO',
'Payout': '0.00%',
'Avg Volume': '420.48K',
'Price': '50.79',
'Recom': '1.29',
'SMA20': '-1.46%',
'SMA50': '9.65%',
'SMA200': '21.95%',
'Volume': '412,506',
'Change': '2.21%'}
- Beta
Show hidden code
beta = float(tk['Beta']) # float is for decimal and int is for integer
beta
Beta: -0.08
- Market Rick Premium
Show hidden code
market_risk_premium = (0.10-risk_free_rate)
market_risk_premium
0.0577400016784668
- Cost of Equity
Show hidden code
# Required Cost of Equity
coe = risk_free_rate + (beta*market_risk_premium)
coe
Cost of Equity: 0.03764079818725586
- Cost of Debt
Show hidden code
interest_expense = income_statement_df.loc['Interest Expense']
interest_expense_df = interest_expense.to_frame().transpose()
interest_expense_str = interest_expense_df.values[0][0]
interest_expense_int = int(interest_expense_str)


# Total Debt
total_debt = balance_sheet_df.loc['Total Debt']
total_debt_df = total_debt.to_frame().transpose()
total_debt_str = total_debt_df.values[0][0]
total_debt_int = int(total_debt_str)

# Required Cost of Debt
cod = interest_expense_int / total_debt_int

print(cod)
Cost of Debt: 0.027837333148903798
- Effective Tax Rate
Show hidden code
# Effective Tax Rate
effective_tax_rate = income_statement_df.loc['Tax Provision'].astype(int) \
                           / income_statement_df.loc['Pretax Income'].astype(int)

avg_effective_tax_rate = sum(effective_tax_rate) / len(effective_tax_rate)
avg_effective_tax_rate
Average Effective Tax Rate: 0.01132463897412178
- Market Cap
Show hidden code
market_cap_str = tk['Market Cap']

market_cap_lst = market_cap_str.split('.')
if market_cap_str[len(market_cap_str)-1] == 'T':
    market_cap_length = len(market_cap_lst[1])-1
    market_cap_lst[1] = market_cap_lst[1].replace('T',(12-market_cap_length)*'0')
    market_cap_int = int(''.join(market_cap_lst))
if market_cap_str[len(market_cap_str)-1] == 'B':
    market_cap_length = len(market_cap_lst[1])-1
    market_cap_lst[1] = market_cap_lst[1].replace('B',(9-market_cap_length)*'0')
    market_cap_int = int(''.join(market_cap_lst))

market_cap_int
Market Cap: 1730000000
- Enterprise Value
Show hidden code
last_cf = cash_flow_df.loc['End Cash Position']
last_cf_df = last_cf.to_frame().transpose()
last_cf_str = last_cf_df.values[0][-1]
last_cf_int = int(last_cf_str)

last_equity = balance_sheet_df.loc['Total Equity Gross Minority Interest']
last_equity_df = last_equity.to_frame().transpose()
last_equity_str = last_equity_df.values[0][-1]
last_equity_int = int(last_equity_str)


enterprise_value = market_cap_int + total_debt_int - last_cf_int

print(enterprise_value)
EV: 1877471000
- WACC Calculation
Show hidden code
WACC = ((last_equity_int/(last_equity_int + total_debt_int)) * coe) \
        + ((total_debt_int/(last_equity_int + total_debt_int)) * cod * (1-avg_effective_tax_rate))

WACC
WACC: 0.03561235594017095
- Calculation of Terminal Value, PV and Firm Value.
Show hidden code
# Equity Value Calculation
discounted_FCFF_lst = []
for year in range(0,5):
    discounted_FCFF = forecast_free_cash_flow_firm_df.iloc[0,year]/(1+WACC)**(year+1)
    discounted_FCFF_lst.append(int(discounted_FCFF))
terminal_value = (forecast_free_cash_flow_firm_df.iloc[0,4]*(1+long_term_growth))/(WACC-long_term_growth)
PV_terminal_value = int(terminal_value/(1+WACC)**6)
firm_value = sum(discounted_FCFF_lst)+PV_terminal_value
equity_value = (firm_value - total_debt_int + last_cf_int) / 10

print(equity_value)
Firm Value: 9748330114.8
- Shares Outstanding
Show hidden code
# Total Shares Outstanding
shares_outstanding_str = tk['Shs Outstand']

shares_outstanding_lst = shares_outstanding_str.split('.')
if shares_outstanding_str[len(shares_outstanding_str)-1] == 'T':
    shares_outstanding_length = len(shares_outstanding_lst[1])-1
    shares_outstanding_lst[1] = shares_outstanding_lst[1].replace('T',(12-shares_outstanding_length)*'0')
    shares_outstanding_int = int(''.join(shares_outstanding_lst))
if shares_outstanding_str[len(shares_outstanding_str)-1] == 'B':
    shares_outstanding_length = len(shares_outstanding_lst[1])-1
    shares_outstanding_lst[1] = shares_outstanding_lst[1].replace('B',(9-shares_outstanding_length)*'0')
    shares_outstanding_int = int(''.join(shares_outstanding_lst))
if shares_outstanding_str[len(shares_outstanding_str)-1] == 'M':
    shares_outstanding_length = len(shares_outstanding_lst[1])-1
    shares_outstanding_lst[1] = shares_outstanding_lst[1].replace('M',(6-shares_outstanding_length)*'0')
    shares_outstanding_int = int(''.join(shares_outstanding_lst))

shares_outstanding_int
Shares Outstanding: 29300000
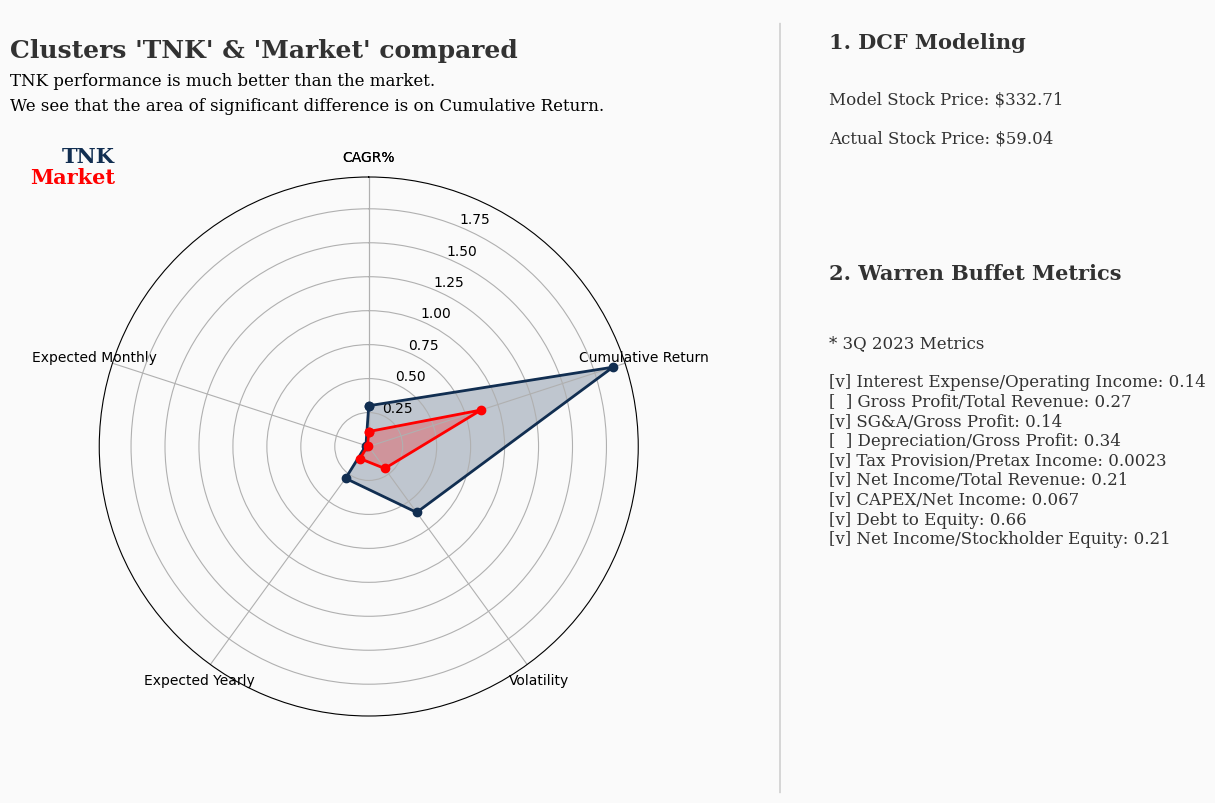
- Model Price and Actual Price Comparison
Show hidden code
# Two-stage FCFF Valuation Model Stock Price Estimate
stock_price = equity_value / shares_outstanding_int
stock_price = '${:,.2f}'.format(stock_price)
print("Model Stock Price = %s"%(stock_price))

# Actual Stock Price
actual_stock_price = market_cap_int / shares_outstanding_int
actual_stock_price = '${:,.2f}'.format(actual_stock_price)
print("Actual Stock Price = %s"%(actual_stock_price))
Model Stock Price = $332.71
Actual Stock Price = $59.04
This company is undervalued through DCF Modeling
Buffet Metrics
- Warren Buffet’s metrics
- Interest Expense / Operating Income < 15%
- Gross Profit / Revenue > 40%
- SG&A / Gross Profit < 30%
- Depreciation / Gross Profit < 8%
- Tax Paid / Pre-tax Income (Earnings Before Tax) ~21%
- Net Income / Revenue > 20%
- Capital Expenditures / Net Income < 8%
- Total Liabilities / Shareholder Equity < 80%
- Net Income / Shareholder Equity > 15%
- 2022 Analysis
Show hidden code
# 2022y only
print('2022y Analaysis')

# Interest Expense / Operating Income < 15%
io = annual_income.loc['Interest Expense'][0]/annual_income.loc['Operating Income'][0]
if io < 0.15:
    print(f'Interest Expense/Operating Income: {io}')
else:
    print('Interest Expense is too high relative to Operating Income')

# Gross Profit / Revenue > 40%
gr = annual_income.loc['Gross Profit'][0]/annual_income.loc['Total Revenue'][0]
if gr > 0.40:
    print(f'Gross Profit/Total Revenue: {gr}')
else:
    print(f'Gross Profit is not enough relative to Total Revenue: {gr}')

# SG&A / Gross Profit < 30%
sgag = annual_income.loc['Selling General And Administration'][0]/annual_income.loc['Gross Profit'][0]
if sgag < 0.30:
    print(f'SG&A/Gross Profit: {sgag}')
else:
    print('SG&A is too large relative to Gross Profit')

# Depreciation / Gross Profit < 8%
dg = annual_income.loc['Reconciled Depreciation'][0]/annual_income.loc['Gross Profit'][0]
if dg < 0.08:
    print(f'Depreciation/Gross Profit: {dg}')
else:
    print(f'Depreciation is too large relative to Gross Profit: {dg}')

# Tax Paid / Pre-tax Income (Earnings Before Tax) ~21%
tr = annual_income.loc['Tax Provision'][0]/annual_income.loc['Pretax Income'][0]
if tr < 0.21:
    print(f'Tax Provision/Pretax Income: {tr}')
else:
    print(f'Tax Provision is too large relative to Pretax Income: {tr}')

# Net Income / Revenue > 20%
nr = annual_income.loc['Net Income'][0]/annual_income.loc['Total Revenue'][0]
if nr > 0.20:
    print(f'Net Income/Total Revenue: {nr}')
else:
    print('Net Income is not enough relative to Total Revenue')

# Capital Expenditures / Net Income < 8%
cn = abs(annual_cash_flow.loc['Capital Expenditure'][0]/annual_income.loc['Net Income'][0])
if cn < 0.08:
    print(f'CAPEX/Net Income: {cn}')
else:
    print('CAPEX is too large relative to Net Income')

# Total Liabilities / Shareholder Equity < 80%
le = annual_balance_sheet.loc['Total Liabilities Net Minority Interest'][0]/annual_balance_sheet.loc['Stockholders Equity'][0]
if le < 0.80:
    print(f'Leverage Ratio: {le}')
else:
    print('Leverage ratio is too high')

# Net Income / Shareholder Equity > 15%
ie = annual_income.loc['Net Income'][0]/annual_balance_sheet.loc['Stockholders Equity'][0]
if ie > 0.15:
    print(f'Earnings per Share (EPS): {ie}')
else:
    print('EPS is not enough for the company')
2022y Analaysis
1. Interest Expense/Operating Income: 0.14360161200242685
2. Gross Profit is not enough relative to Total Revenue: 0.2733976038250004
3. SG&A/Gross Profit: 0.1437079393914372
4. Depreciation is too large relative to Gross Profit: 0.3407270550348871
5. Tax Provision/Pretax Income: 0.002303856455370947
6. Net Income/Total Revenue: 0.2154864355650539
7. CAPEX/Net Income: 0.06735461791641567
8. Leverage Ratio: 0.6669570077177137
9. Earnings per Share (EPS): 0.21409786487178575
Only two metrics are not good enough for 2022y
- 2019 - 2022 Analysis
Show hidden code
# 2019 - 2022
print('2019y-2022y Analysis')

# Interest Expense / Operating Income < 15%
io = annual_income.loc['Interest Expense']/annual_income.loc['Operating Income']
io = sum(io)/len(io)
if io < 0.15:
    print(f'Interest Expense/Operating Income: {io}')
else:
    print(f'Interest Expense is too high relative to Operating Income: {io}')

# Gross Profit / Revenue > 40%
gr = annual_income.loc['Gross Profit']/annual_income.loc['Total Revenue']
gr = sum(gr)/len(gr)
if gr > 0.40:
    print(f'Gross Profit/Total Revenue: {gr}')
else:
    print(f'Gross Profit is not enough relative to Total Revenue: {gr}')

# SG&A / Gross Profit < 30%
sgag = annual_income.loc['Selling General And Administration']/annual_income.loc['Gross Profit']
sgag = sum(sgag)/len(sgag)
if sgag < 0.30:
    print(f'SG&A/Gross Profit: {sgag}')
else:
    print('SG&A is too large relative to Gross Profit')

# Depreciation / Gross Profit < 8%
dg = annual_income.loc['Reconciled Depreciation']/annual_income.loc['Gross Profit']
dg = sum(dg)/len(dg)
if dg < 0.08:
    print(f'Depreciation/Gross Profit: {dg}')
else:
    print(f'Depreciation is too large relative to Gross Profit: {dg}')

# Tax Paid / Pre-tax Income (Earnings Before Tax) ~21%
tr = annual_income.loc['Tax Provision']/annual_income.loc['Pretax Income']
tr = sum(tr)/len(tr)
if tr < 0.21:
    print(f'Tax Provision/Pretax Income: {tr}')
else:
    print(f'Tax Provision is too large relative to Pretax Income: {tr}')

# Net Income / Revenue > 20%
nr = annual_income.loc['Net Income']/annual_income.loc['Total Revenue']
nr = sum(nr)/len(nr)
if nr > 0.20:
    print(f'Net Income/Total Revenue: {nr}')
else:
    print('Net Income is not enough relative to Total Revenue')

# Capital Expenditures / Net Income < 8%
cn = abs(annual_cash_flow.loc['Capital Expenditure']/annual_income.loc['Net Income'])
cn = sum(cn)/len(cn)
if cn < 0.08:
    print(f'CAPEX/Net Income: {cn}')
else:
    print(f'CAPEX is too large relative to Net Income: {cn}')

# Total Liabilities / Shareholder Equity < 80%
le = (annual_balance_sheet.loc['Total Liabilities Net Minority Interest']/annual_balance_sheet.loc['Stockholders Equity'])
le = sum(le)/len(le)
if le < 0.80:
    print(f'Leverage Ratio: {le}')
else:
    print(f'Leverage ratio is too high: {le}')

# Net Income / Shareholder Equity > 15%
ie = annual_income.loc['Net Income']/annual_balance_sheet.loc['Stockholders Equity']
ie = sum(ie)/len(ie)
if ie > 0.15:
    print(f'Earnings per Share (EPS): {ie}')
else:
    print(f'EPS is not enough for the company: {ie}')
2019y-2022y Analysis
Interest Expense is too high relative to Operating Income: 0.15991957466416531
Gross Profit is not enough relative to Total Revenue: 0.15720203811447034
SG&A/Gross Profit: -0.05838760684888775
Depreciation/Gross Profit: -0.06710785538280992
Tax Provision/Pretax Income: 0.14330527783322572
Net Income is not enough relative to Total Revenue
CAPEX is too large relative to Net Income: 0.15512421430566428
Leverage ratio is too high: 0.8910497806271792
EPS is not enough for the company: 0.011931947689316063
2019y to 2022y are not good enough for Buffet’s metrics. This company is profitable after Covid and Crude oil is cheaper
- 3Q 2023 Analysis
Show hidden code
# 09-30-23
print('3Q-23 Analysis')

annual_income = income_statement_df
annual_cash_flow = cash_flow_df
annual_balance_sheet = balance_sheet_df

# Interest Expense / Operating Income < 15%
io = annual_income.loc['Interest Expense'][0]/annual_income.loc['Operating Income'][0]
if io < 0.15:
    print(f'Interest Expense/Operating Income: {io}')
else:
    print('Interest Expense is too high relative to Operating Income')

# Gross Profit / Revenue > 40%
gr = annual_income.loc['Gross Profit'][0]/annual_income.loc['Total Revenue'][0]
if gr > 0.40:
    print(f'Gross Profit/Total Revenue: {gr}')
else:
    print(f'Gross Profit is not enough relative to Total Revenue: {gr}')

# SG&A / Gross Profit < 30%
sgag = annual_income.loc['Selling General And Administration'][0]/annual_income.loc['Gross Profit'][0]
if sgag < 0.30:
    print(f'SG&A/Gross Profit: {sgag}')
else:
    print('SG&A is too large relative to Gross Profit')

# Depreciation / Gross Profit < 8%
dg = annual_income.loc['Reconciled Depreciation'][0]/annual_income.loc['Gross Profit'][0]
if dg < 0.08:
    print(f'Depreciation/Gross Profit: {dg}')
else:
    print(f'Depreciation is too large relative to Gross Profit: {dg}')

# Tax Paid / Pre-tax Income (Earnings Before Tax) ~21%
tr = annual_income.loc['Tax Provision'][0]/annual_income.loc['Pretax Income'][0]
if tr < 0.21:
    print(f'Tax Provision/Pretax Income: {tr}')
else:
    print(f'Tax Provision is too large relative to Pretax Income: {tr}')

# Net Income / Revenue > 20%
nr = annual_income.loc['Net Income'][0]/annual_income.loc['Total Revenue'][0]
if nr > 0.20:
    print(f'Net Income/Total Revenue: {nr}')
else:
    print('Net Income is not enough relative to Total Revenue')

# Capital Expenditures / Net Income < 8%
cn = abs(annual_cash_flow.loc['Capital Expenditure'][0]/annual_income.loc['Net Income'][0])
if cn < 0.08:
    print(f'CAPEX/Net Income: {cn}')
else:
    print('CAPEX is too large relative to Net Income')

# Total Liabilities / Shareholder Equity < 80%
le = annual_balance_sheet.loc['Total Liabilities Net Minority Interest'][0]/annual_balance_sheet.loc['Stockholders Equity'][0]
if le < 0.80:
    print(f'Debt to Equity: {le}')
else:
    print('Debt is too high')

# Net Income / Shareholder Equity > 15%
ie = annual_income.loc['Net Income'][0]/annual_balance_sheet.loc['Stockholders Equity'][0]
if ie > 0.15:
    print(f'Net Income/Stockholders Equity: {ie}')
else:
    print(f'Net Income is not enough relative to Stockholders equity: {ie}')
3Q-23 Analysis
Interest Expense/Operating Income: 0.07894575543977934
Gross Profit is not enough relative to Total Revenue: 0.32280013153383846
SG&A/Gross Profit: 0.11595773503115687
Depreciation is too large relative to Gross Profit: 0.26621511785424007
Tax Provision/Pretax Income: -0.03206575509272178
Net Income/Total Revenue: 0.284637827172932
CAPEX/Net Income: 0.04025022736769658
Debt to Equity: 0.245421902420668
Net Income is not enough relative to Stockholders equity: 0.057230879606672225
Three metrics are not good enough for 3Q-23
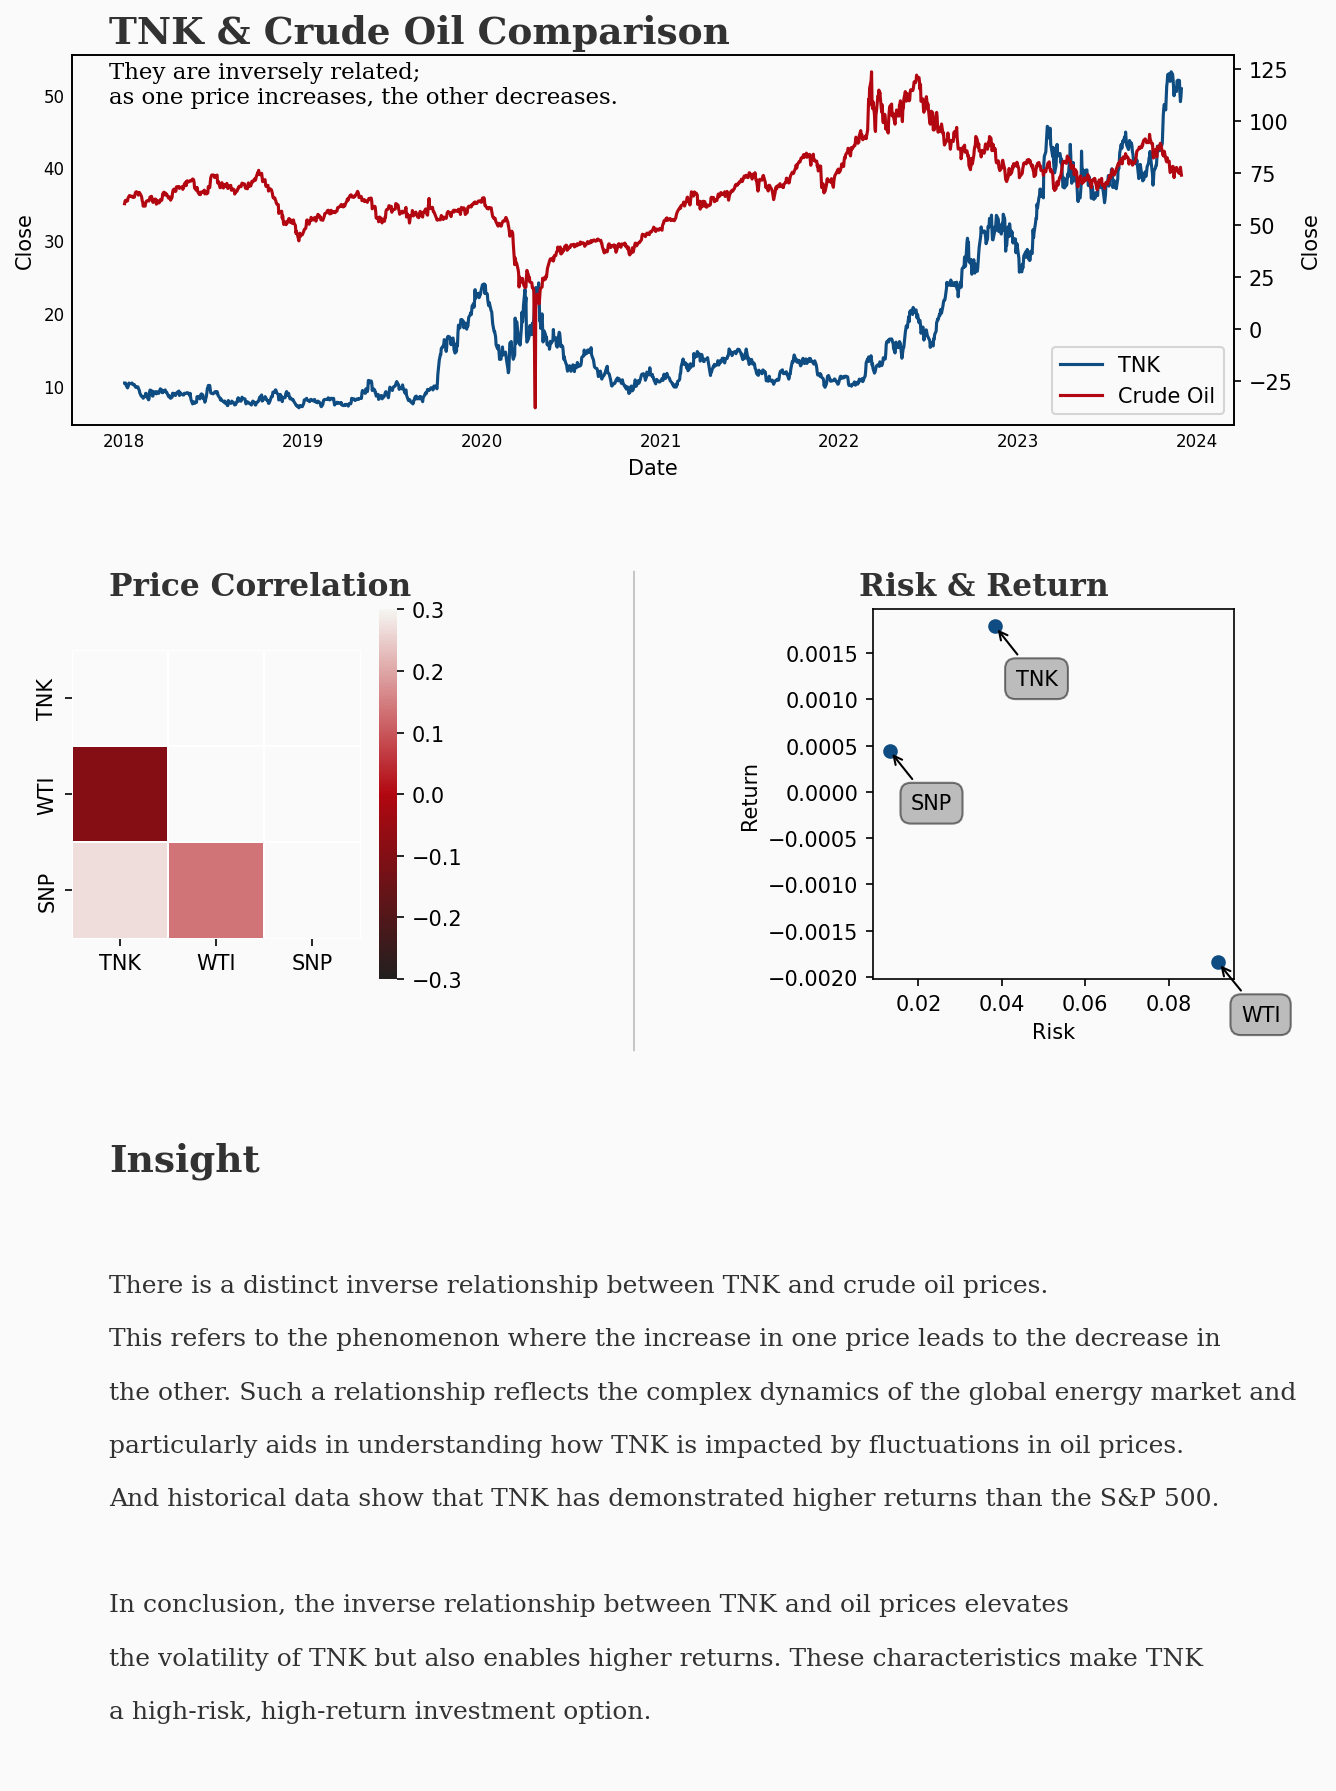
Correlation
Correlation between TNK, Crude Oil and S&P500
- TNK price history
Show hidden code
price = ticker.history(
    start = '2018-01-01',
    end = '2023-12-02',
    interval = '1d',
    )['Close']
Date
2018-01-02 00:00:00-05:00 10.383956
2018-01-03 00:00:00-05:00 10.383956
2018-01-04 00:00:00-05:00 10.383956
2018-01-05 00:00:00-05:00 10.085136
2018-01-08 00:00:00-05:00 9.711613
2018-01-09 00:00:00-05:00 9.861023
2018-01-10 00:00:00-05:00 10.085136
2018-01-11 00:00:00-05:00 10.383956
2018-01-12 00:00:00-05:00 10.309251 ... ...
2023-11-06 00:00:00-05:00 52.891171
2023-11-07 00:00:00-05:00 52.075008
2023-11-08 00:00:00-05:00 51.826180
2023-11-09 00:00:00-05:00 52.224308
2023-11-10 00:00:00-05:00 53.139999
2023-11-13 00:00:00-05:00 52.799999
2023-11-14 00:00:00-05:00 52.090000
2023-11-15 00:00:00-05:00 50.900002
2023-11-16 00:00:00-05:00 49.849998
2023-11-17 00:00:00-05:00 50.889999
2023-11-20 00:00:00-05:00 50.830002
2023-11-21 00:00:00-05:00 50.430000
2023-11-22 00:00:00-05:00 51.880001
2023-11-24 00:00:00-05:00 51.990002
2023-11-27 00:00:00-05:00 51.939999
2023-11-28 00:00:00-05:00 50.220001
2023-11-29 00:00:00-05:00 49.040001
2023-11-30 00:00:00-05:00 49.689999
2023-12-01 00:00:00-05:00 50.790001
Name: Close, dtype: float64
- Crude oil price history
Show hidden code
wti = yf.Ticker('CL=F')
price_wti = wti.history(
    start = '2018-01-01',
    end = '2023-12-02',
    interval= '1d',
)['Close']
price_wti
Date
2018-01-02 00:00:00-05:00 60.369999
2018-01-03 00:00:00-05:00 61.630001
2018-01-04 00:00:00-05:00 62.009998
2018-01-05 00:00:00-05:00 61.439999
2018-01-08 00:00:00-05:00 61.730000
2018-01-09 00:00:00-05:00 62.959999
2018-01-10 00:00:00-05:00 63.570000
2018-01-11 00:00:00-05:00 63.799999
2018-01-12 00:00:00-05:00 64.300003 ... ...
2023-11-06 00:00:00-05:00 80.820000
2023-11-07 00:00:00-05:00 77.370003
2023-11-08 00:00:00-05:00 75.330002
2023-11-09 00:00:00-05:00 75.739998
2023-11-10 00:00:00-05:00 77.169998
2023-11-13 00:00:00-05:00 78.260002
2023-11-14 00:00:00-05:00 78.260002
2023-11-15 00:00:00-05:00 76.660004
2023-11-16 00:00:00-05:00 72.900002
2023-11-17 00:00:00-05:00 75.889999
2023-11-20 00:00:00-05:00 77.599998
2023-11-21 00:00:00-05:00 77.769997
2023-11-22 00:00:00-05:00 77.099998
2023-11-23 00:00:00-05:00 76.349998
2023-11-24 00:00:00-05:00 75.540001
2023-11-27 00:00:00-05:00 74.860001
2023-11-28 00:00:00-05:00 76.410004
2023-11-29 00:00:00-05:00 77.860001
2023-11-30 00:00:00-05:00 75.959999
2023-12-01 00:00:00-05:00 74.070000
Name: Close, dtype: float64
- S&P500 price history
Show hidden code
snp = yf.Ticker('^GSPC')
price_snp = snp.history(
        start = '2018-01-01',
    end = '2023-12-02',
    interval= '1d',
)['Close']

price_snp
Date
2018-01-02 00:00:00-05:00 2695.810059
2018-01-03 00:00:00-05:00 2713.060059
2018-01-04 00:00:00-05:00 2723.989990
2018-01-05 00:00:00-05:00 2743.149902
2018-01-08 00:00:00-05:00 2747.709961
2018-01-09 00:00:00-05:00 2751.290039
2018-01-10 00:00:00-05:00 2748.229980
2018-01-11 00:00:00-05:00 2767.560059
2018-01-12 00:00:00-05:00 2786.239990 ... ...
2023-11-06 00:00:00-05:00 4365.979980
2023-11-07 00:00:00-05:00 4378.379883
2023-11-08 00:00:00-05:00 4382.779785
2023-11-09 00:00:00-05:00 4347.350098
2023-11-10 00:00:00-05:00 4415.240234
2023-11-13 00:00:00-05:00 4411.549805
2023-11-14 00:00:00-05:00 4495.700195
2023-11-15 00:00:00-05:00 4502.879883
2023-11-16 00:00:00-05:00 4508.240234
2023-11-17 00:00:00-05:00 4514.020020
2023-11-20 00:00:00-05:00 4547.379883
2023-11-21 00:00:00-05:00 4538.189941
2023-11-22 00:00:00-05:00 4556.620117
2023-11-24 00:00:00-05:00 4559.339844
2023-11-27 00:00:00-05:00 4550.430176
2023-11-28 00:00:00-05:00 4554.890137
2023-11-29 00:00:00-05:00 4550.580078
2023-11-30 00:00:00-05:00 4567.799805
2023-12-01 00:00:00-05:00 4594.629883
Name: Close, dtype: float64
- Price chart between TNK and Crude oil
Show hidden code
import matplotlib.pyplot as plt

fig, ax = plt.subplots(figsize=(12,8))

l1 = ax.plot(price, color='blue', label='TNK')
ax.set_title('TNK & Crude Oil')
ax.set_xlabel('Date')

ax1 = ax.twinx()
l2 = ax1.plot(price_wti, color='green', label='Crude Oil')

# ax2 = ax1.twinx()
# l3 = ax2.plot(price_snp, color='red', label='S&P')

ax.grid
ax.legend(handles=l1+l2, loc=2)
plt.show()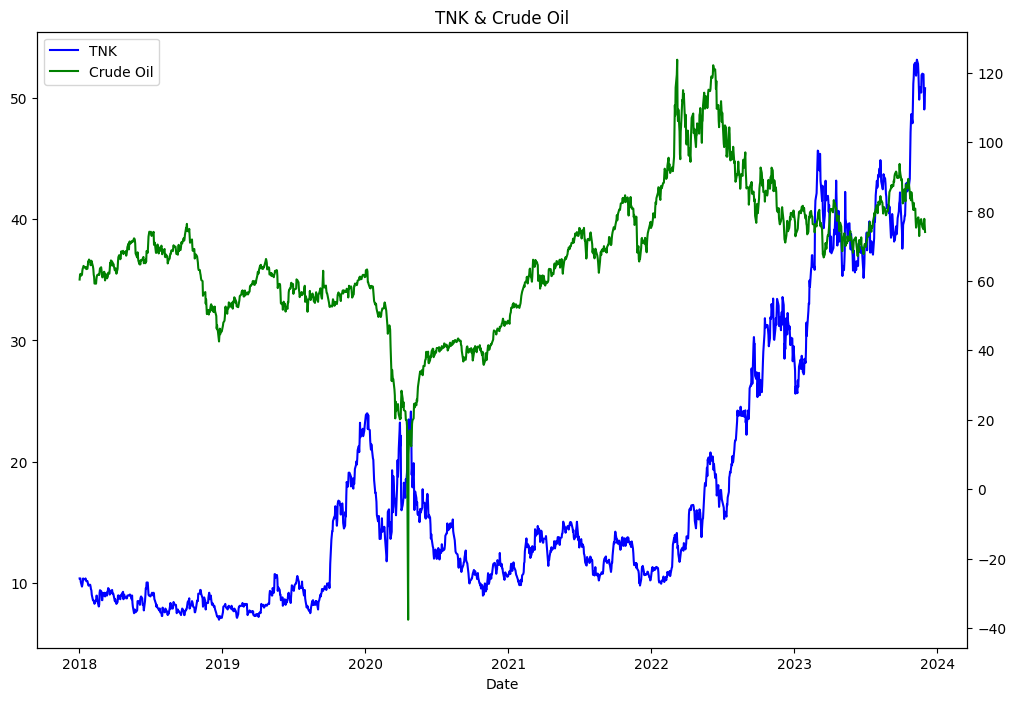
- Price merged
Show hidden code
price_df = pd.DataFrame()

price_df['TNK'] = price
price_df['WTI'] = price_wti
price_df['SNP'] = price_snp
price_df.head()| TNK | WTI | SNP | |
|---|---|---|---|
| Date | |||
| 2018-01-02 00:00:00-05:00 | 10.383956 | 60.369999 | 2695.810059 |
| 2018-01-03 00:00:00-05:00 | 10.383956 | 61.630001 | 2713.060059 |
| 2018-01-04 00:00:00-05:00 | 10.383956 | 62.009998 | 2723.989990 |
| 2018-01-05 00:00:00-05:00 | 10.085136 | 61.439999 | 2743.149902 |
| 2018-01-08 00:00:00-05:00 | 9.711613 | 61.730000 | 2747.709961 |
- Returns during the term
Show hidden code
```python
returns = (price_df.pct_change()+1).product()-1
returns
```
TNK 3.891200
WTI 0.226934
SNP 0.704360
dtype: float64
- Calculation correlation
Show hidden code
```python
changes = price_df.pct_change()
corr = changes.corr()
corr.head()
```| TNK | WTI | SNP | |
|---|---|---|---|
| TNK | 1.000000 | -0.093197 | 0.269204 |
| WTI | -0.093197 | 1.000000 | 0.137419 |
| SNP | 0.269204 | 0.137419 | 1.000000 |
- Show hotmap with correlation
Show hidden code
```python
plt.figure(figsize=(16,8))
plt.grid(False)
plt.imshow(corr, cmap='hot', interpolation='none')
plt.colorbar()
plt.xticks(range(len(corr)), corr.columns, rotation=90)
plt.yticks(range(len(corr)), corr.columns)
plt.show()
```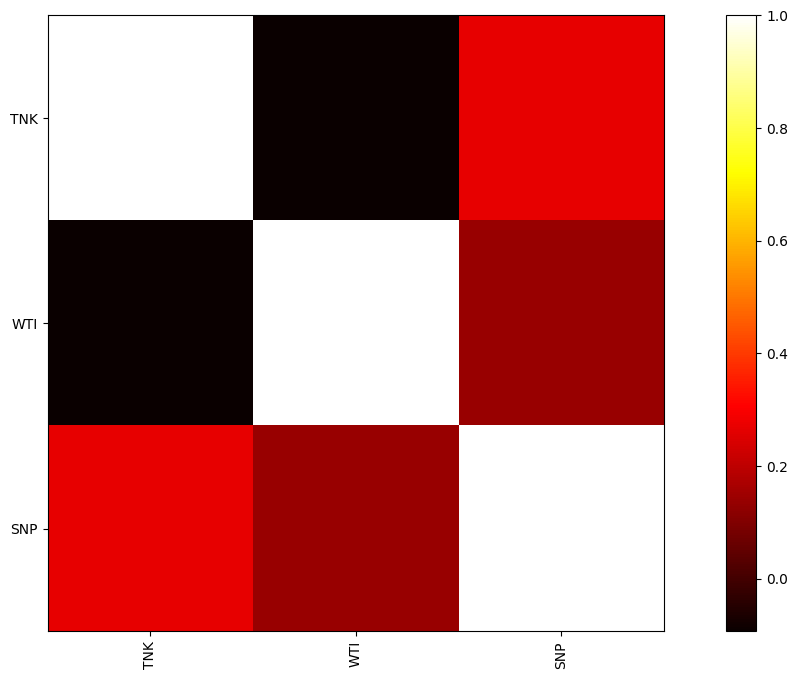
Crude oil and TNK is inversed. if oil price is dropped, TNK price is up.
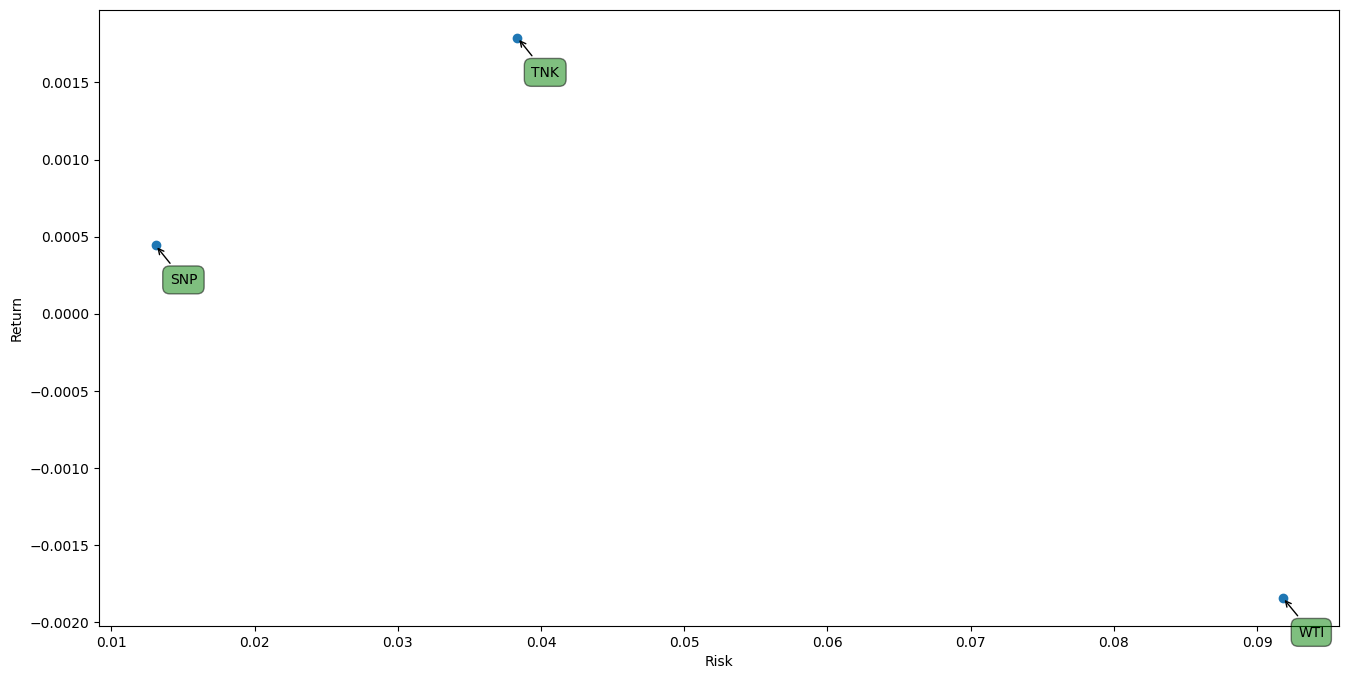
- Risk & Return
Show hidden code
```python
plt.figure(figsize=(16,8))
plt.scatter(changes.std(), changes.mean())
plt.xlabel('Risk')
plt.ylabel('Return')
plt.xlim()
plt.ylim()
for label, x, y in zip(changes.columns, changes.std(), changes.mean()):
    plt.annotate(label, xy=(x, y), xytext=(30, -30),
    textcoords = 'offset points',
    ha = 'right', va = 'bottom',
    bbox = dict(boxstyle = 'round,pad=0.5', fc = 'green', alpha = 0.5),
    arrowprops = dict(arrowstyle = '->', connectionstyle = 'arc3, rad=0'))
```
Conclusion
- Quantitative Analysis