Data Science/Machine Learning Training(Python)
import numpy as np
import sklearn
import pandas as pd
import matplotlib.pyplot as plt
import graphviz
import mglearn
from sklearn.datasets import load_breast_cancer
from sklearn.model_selection import train_test_split

from sklearn.tree import DecisionTreeClassifier

cancer = load_breast_cancer()
X_train, X_test, y_train, y_test = train_test_split(cancer.data, cancer.target, stratify=cancer.target, random_state=42)
tree = DecisionTreeClassifier(random_state=0)
tree.fit(X_train, y_train)

tree = DecisionTreeClassifier(max_depth=4, random_state=0)
tree.fit(X_train, y_train)

from sklearn.tree import export_graphviz
export_graphviz(tree, out_file="tree.dot", class_names=["malignant", "benign"],feature_names=cancer.feature_names, impurity=False, filled=True)

import graphviz
with open("tree.dot") as f:
    dot_graph = f.read()
graphviz.Source(dot_graph)

New Section
from sklearn.datasets import load_breast_cancer
from sklearn.tree import DecisionTreeClassifier
from sklearn.model_selection import train_test_split

cancer = load_breast_cancer()
X_train, X_test, y_train, y_test = train_test_split(
    cancer.data, cancer.target, stratify=cancer.target, random_state=42)
tree = DecisionTreeClassifier(random_state=0)
tree.fit(X_train, y_train)
print("훈련 세트 정확도: {:.3f}".format(tree.score(X_train, y_train)))
print("테스트 세트 정확도: {:.3f}".format(tree.score(X_test, y_test)))
훈련 세트 정확도: 1.000
테스트 세트 정확도: 0.937
tree = DecisionTreeClassifier(max_depth=4, random_state=0)
tree.fit(X_train, y_train)

print("훈련 세트 정확도: {:.3f}".format(tree.score(X_train, y_train)))
print("테스트 세트 정확도: {:.3f}".format(tree.score(X_test, y_test)))
훈련 세트 정확도: 0.988
테스트 세트 정확도: 0.951
from sklearn.tree import export_graphviz
export_graphviz(tree, out_file="tree.dot", class_names=["악성", "양성"],
                feature_names=cancer.feature_names,
                impurity=False, filled=True)
import graphviz

with open("tree.dot") as f:
    dot_graph = f.read()
display(graphviz.Source(dot_graph))

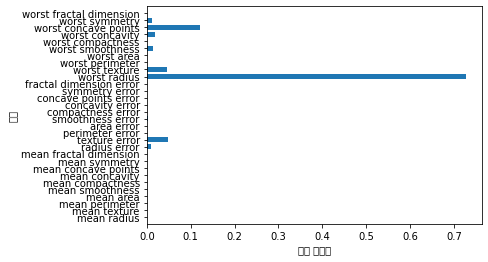
print("특성 중요도:\n{}".format(tree.feature_importances_))
특성 중요도:
[0.         0.         0.         0.         0.         0.
 0.         0.         0.         0.         0.01019737 0.04839825
 0.         0.         0.0024156  0.         0.         0.
 0.         0.         0.72682851 0.0458159  0.         0.
 0.0141577  0.         0.018188   0.1221132  0.01188548 0.        ]
import numpy as np


def plot_feature_importances_cancer(model):
    n_features = cancer.data.shape[1]
    plt.barh(range(n_features), model.feature_importances_, align='center')
    plt.yticks(np.arange(n_features), cancer.feature_names)
    plt.xlabel("특성 중요도")
    plt.ylabel("특성")
    plt.ylim(-1, n_features)

plot_feature_importances_cancer(tree)
/usr/local/lib/python3.7/dist-packages/matplotlib/backends/backend_agg.py:214: RuntimeWarning: Glyph 53945 missing from current font.
  font.set_text(s, 0.0, flags=flags)
/usr/local/lib/python3.7/dist-packages/matplotlib/backends/backend_agg.py:214: RuntimeWarning: Glyph 49457 missing from current font.
  font.set_text(s, 0.0, flags=flags)
/usr/local/lib/python3.7/dist-packages/matplotlib/backends/backend_agg.py:214: RuntimeWarning: Glyph 51473 missing from current font.
  font.set_text(s, 0.0, flags=flags)
/usr/local/lib/python3.7/dist-packages/matplotlib/backends/backend_agg.py:214: RuntimeWarning: Glyph 50836 missing from current font.
  font.set_text(s, 0.0, flags=flags)
/usr/local/lib/python3.7/dist-packages/matplotlib/backends/backend_agg.py:214: RuntimeWarning: Glyph 46020 missing from current font.
  font.set_text(s, 0.0, flags=flags)
/usr/local/lib/python3.7/dist-packages/matplotlib/backends/backend_agg.py:183: RuntimeWarning: Glyph 53945 missing from current font.
  font.set_text(s, 0, flags=flags)
/usr/local/lib/python3.7/dist-packages/matplotlib/backends/backend_agg.py:183: RuntimeWarning: Glyph 49457 missing from current font.
  font.set_text(s, 0, flags=flags)
/usr/local/lib/python3.7/dist-packages/matplotlib/backends/backend_agg.py:183: RuntimeWarning: Glyph 51473 missing from current font.
  font.set_text(s, 0, flags=flags)
/usr/local/lib/python3.7/dist-packages/matplotlib/backends/backend_agg.py:183: RuntimeWarning: Glyph 50836 missing from current font.
  font.set_text(s, 0, flags=flags)
/usr/local/lib/python3.7/dist-packages/matplotlib/backends/backend_agg.py:183: RuntimeWarning: Glyph 46020 missing from current font.
  font.set_text(s, 0, flags=flags)
import mglearn

tree = mglearn.plots.plot_tree_not_monotone()
display(tree)
Feature importances: [0. 1.]

import os
import pandas as pd
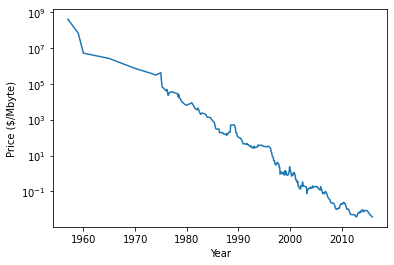
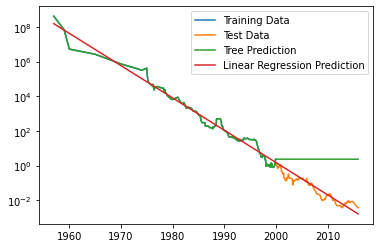
ram_prices = pd.read_csv(os.path.join(mglearn.datasets.DATA_PATH, "ram_price.csv"))
plt.semilogy(ram_prices.date, ram_prices.price)
plt.xlabel("Year")
plt.ylabel("Price ($/Mbyte)")
Text(0, 0.5, 'Price ($/Mbyte)')
import pandas as pd
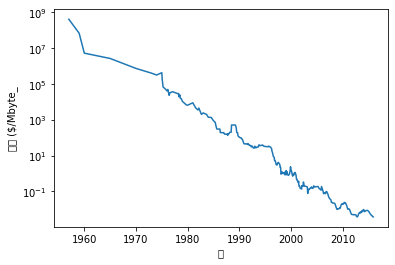
ram_prices = pd.read_csv(os.path.join(mglearn.datasets.DATA_PATH, "ram_price.csv"))
plt.semilogy(ram_prices.date, ram_prices.price)
plt.xlabel("년")
plt.ylabel("가격 ($/Mbyte_")
Text(0, 0.5, '가격 ($/Mbyte_')


/usr/local/lib/python3.7/dist-packages/matplotlib/backends/backend_agg.py:214: RuntimeWarning: Glyph 45380 missing from current font.
  font.set_text(s, 0.0, flags=flags)
/usr/local/lib/python3.7/dist-packages/matplotlib/backends/backend_agg.py:183: RuntimeWarning: Glyph 45380 missing from current font.
  font.set_text(s, 0, flags=flags)
/usr/local/lib/python3.7/dist-packages/matplotlib/backends/backend_agg.py:214: RuntimeWarning: Glyph 44032 missing from current font.
  font.set_text(s, 0.0, flags=flags)
/usr/local/lib/python3.7/dist-packages/matplotlib/backends/backend_agg.py:214: RuntimeWarning: Glyph 44201 missing from current font.
  font.set_text(s, 0.0, flags=flags)
/usr/local/lib/python3.7/dist-packages/matplotlib/backends/backend_agg.py:183: RuntimeWarning: Glyph 44032 missing from current font.
  font.set_text(s, 0, flags=flags)
/usr/local/lib/python3.7/dist-packages/matplotlib/backends/backend_agg.py:183: RuntimeWarning: Glyph 44201 missing from current font.
  font.set_text(s, 0, flags=flags)
ram_prices.info()
<class 'pandas.core.frame.DataFrame'>
RangeIndex: 333 entries, 0 to 332
Data columns (total 3 columns):
 #   Column      Non-Null Count  Dtype
---  ------      --------------  -----
 0   Unnamed: 0  333 non-null    int64
 1   date        333 non-null    float64
 2   price       333 non-null    float64
dtypes: float64(2), int64(1)
memory usage: 7.9 KB
ram_prices.describe()
| Unnamed: 0 | date | price | |
|---|---|---|---|
| count | 333.000000 | 333.000000 | 3.330000e+02 |
| mean | 166.000000 | 1996.878168 | 1.469755e+06 |
| std | 96.273049 | 11.026537 | 2.281991e+07 |
| min | 0.000000 | 1957.000000 | 3.700000e-03 |
| 25% | 83.000000 | 1989.670000 | 1.260000e-01 |
| 50% | 166.000000 | 1996.750000 | 8.000000e+00 |
| 75% | 249.000000 | 2005.250000 | 1.330000e+02 |
| max | 332.000000 | 2015.920000 | 4.110418e+08 |
ram_prices.head()
| Unnamed: 0 | date | price | |
|---|---|---|---|
| 0 | 0 | 1957.0 | 411041792.0 |
| 1 | 1 | 1959.0 | 67947725.0 |
| 2 | 2 | 1960.0 | 5242880.0 |
| 3 | 3 | 1965.0 | 2642412.0 |
| 4 | 4 | 1970.0 | 734003.0 |
from sklearn.linear_model import LinearRegression
from sklearn.tree import DecisionTreeRegressor
# 2000년 이전을 훈련 데이터로, 2000년 이후를 테스트 데이터로 만듭니다.
data_train = ram_prices[ram_prices.date < 2000]
data_test = ram_prices[ram_prices.date >= 2000]

# 가격 예측을 위해 날짜 특성만을 이용합니다.
X_train = data_train.date[:, np.newaxis]
# 데이터와 타깃의 관계를 간단하게 만들기 위해 로그 스케일로 바꿉니다.
y_train = np.log(data_train.price)

tree = DecisionTreeRegressor().fit(X_train, y_train)
linear_reg = LinearRegression().fit(X_train, y_train)

# 예측은 전체 기간에 대해서 수행합니다.
X_all = ram_prices.date[:, np.newaxis]

pred_tree = tree.predict(X_all)
pred_lr = linear_reg.predict(X_all)

# 예측한 값의 로그 스케일을 되돌립니다.
price_tree = np.exp(pred_tree)
price_lr = np.exp(pred_lr)
/usr/local/lib/python3.7/dist-packages/ipykernel_launcher.py:8: FutureWarning: Support for multi-dimensional indexing (e.g. `obj[:, None]`) is deprecated and will be removed in a future version.  Convert to a numpy array before indexing instead.

/usr/local/lib/python3.7/dist-packages/ipykernel_launcher.py:16: FutureWarning: Support for multi-dimensional indexing (e.g. `obj[:, None]`) is deprecated and will be removed in a future version.  Convert to a numpy array before indexing instead.
  app.launch_new_instance()
plt.semilogy(data_train.date, data_train.price, label="Training Data")
plt.semilogy(data_test.date, data_test.price, label="Test Data")
plt.semilogy(ram_prices.date, price_tree, label="Tree Prediction")
plt.semilogy(ram_prices.date, price_lr, label="Linear Regression Prediction")
plt.legend()
<matplotlib.legend.Legend at 0x7f371ba1b2d0>
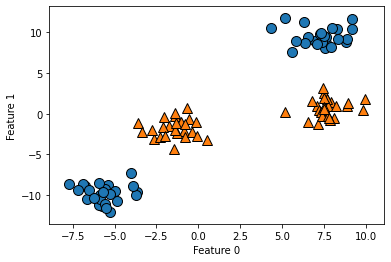
from sklearn.datasets import make_blobs

X, y = make_blobs(centers=4, random_state=8)
y = y % 2

mglearn.discrete_scatter(X[:, 0], X[:, 1], y)
plt.xlabel("Feature 0")
plt.ylabel("Feature 1")
Text(0, 0.5, 'Feature 1')
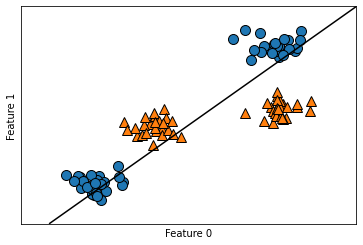
from sklearn.svm import LinearSVC
linear_svm = LinearSVC().fit(X, y)

mglearn.plots.plot_2d_separator(linear_svm, X)
mglearn.discrete_scatter(X[:, 0], X[:, 1], y)
plt.xlabel("Feature 0")
plt.ylabel("Feature 1")
/usr/local/lib/python3.7/dist-packages/sklearn/svm/_base.py:947: ConvergenceWarning: Liblinear failed to converge, increase the number of iterations.
  "the number of iterations.", ConvergenceWarning)


Text(0, 0.5, 'Feature 1')
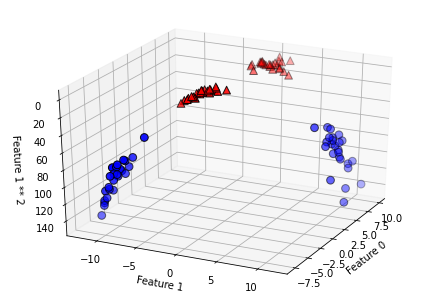
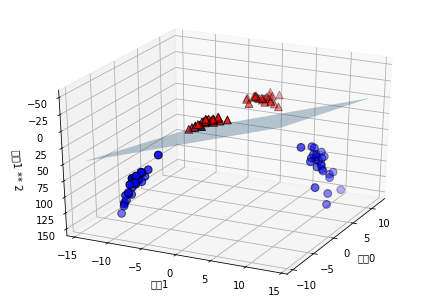
# 두 번째 특성을 제곱하여 추가합니다.
X_new = np.hstack([X, X[:, 1:] ** 2])

from mpl_toolkits.mplot3d import Axes3D, axes3d
figure = plt.figure()
# 3차원 그래프
ax = Axes3D(figure, elev=-152, azim=-26)
# y == 0인 포인트를 먼저 그리고 그다음 y == 1인 포인트를 그립니다.
mask = y == 0
ax.scatter(X_new[mask, 0], X_new[mask, 1], X_new[mask, 2], c='b',
           cmap=mglearn.cm2, s=60, edgecolor='k')
ax.scatter(X_new[~mask, 0], X_new[~mask, 1], X_new[~mask, 2], c='r', marker='^',
           cmap=mglearn.cm2, s=60, edgecolor='k')
ax.set_xlabel("Feature 0")
ax.set_ylabel("Feature 1")
ax.set_zlabel("Feature 1 ** 2")
Text(0.5, 0, 'Feature 1 ** 2')
linear_svm_3d = LinearSVC().fit(X_new, y)
coef, intercept = linear_svm_3d.coef_.ravel(), linear_svm_3d.intercept_

# 선형 결정 경계 그리기
figure = plt.figure()
ax = Axes3D(figure, elev=-152, azim=-26)
xx = np.linspace(X_new[:, 0].min() - 2, X_new[:, 0].max() + 2, 50)
yy = np.linspace(X_new[:, 1].min() - 2, X_new[:, 1].max() + 2, 50)

XX, YY = np.meshgrid(xx, yy)
ZZ = (coef[0] * XX + coef[1] * YY + intercept) / -coef[2]
ax.plot_surface(XX, YY, ZZ, rstride=8, cstride=8, alpha=0.3)
ax.scatter(X_new[mask, 0], X_new[mask, 1], X_new[mask, 2], c='b',
           cmap=mglearn.cm2, s=60, edgecolor='k')
ax.scatter(X_new[~mask, 0], X_new[~mask, 1], X_new[~mask, 2], c='r', marker='^',
           cmap=mglearn.cm2, s=60, edgecolor='k')

ax.set_xlabel("특성0")
ax.set_ylabel("특성1")
ax.set_zlabel("특성1 ** 2")
/usr/local/lib/python3.7/dist-packages/sklearn/svm/_base.py:947: ConvergenceWarning: Liblinear failed to converge, increase the number of iterations.
  "the number of iterations.", ConvergenceWarning)


Text(0.5, 0, '특성1 ** 2')


/usr/local/lib/python3.7/dist-packages/matplotlib/backends/backend_agg.py:214: RuntimeWarning: Glyph 53945 missing from current font.
  font.set_text(s, 0.0, flags=flags)
/usr/local/lib/python3.7/dist-packages/matplotlib/backends/backend_agg.py:214: RuntimeWarning: Glyph 49457 missing from current font.
  font.set_text(s, 0.0, flags=flags)
/usr/local/lib/python3.7/dist-packages/matplotlib/backends/backend_agg.py:183: RuntimeWarning: Glyph 53945 missing from current font.
  font.set_text(s, 0, flags=flags)
/usr/local/lib/python3.7/dist-packages/matplotlib/backends/backend_agg.py:183: RuntimeWarning: Glyph 49457 missing from current font.
  font.set_text(s, 0, flags=flags)
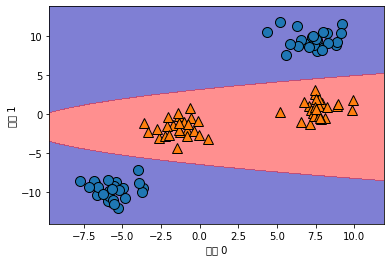
ZZ = YY ** 2
dec = linear_svm_3d.decision_function(np.c_[XX.ravel(), YY.ravel(), ZZ.ravel()])
plt.contourf(XX, YY, dec.reshape(XX.shape), levels=[dec.min(), 0, dec.max()],
             cmap=mglearn.cm2, alpha=0.5)
mglearn.discrete_scatter(X[:, 0], X[:, 1], y)
plt.xlabel("특성 0")
plt.ylabel("특성 1")
Text(0, 0.5, '특성 1')


/usr/local/lib/python3.7/dist-packages/matplotlib/backends/backend_agg.py:214: RuntimeWarning: Glyph 53945 missing from current font.
  font.set_text(s, 0.0, flags=flags)
/usr/local/lib/python3.7/dist-packages/matplotlib/backends/backend_agg.py:214: RuntimeWarning: Glyph 49457 missing from current font.
  font.set_text(s, 0.0, flags=flags)
/usr/local/lib/python3.7/dist-packages/matplotlib/backends/backend_agg.py:183: RuntimeWarning: Glyph 53945 missing from current font.
  font.set_text(s, 0, flags=flags)
/usr/local/lib/python3.7/dist-packages/matplotlib/backends/backend_agg.py:183: RuntimeWarning: Glyph 49457 missing from current font.
  font.set_text(s, 0, flags=flags)
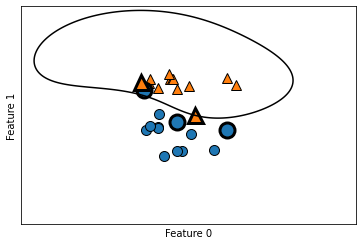
from sklearn.svm import SVC
X, y = mglearn.tools.make_handcrafted_dataset()
svm = SVC(kernel='rbf', C=10, gamma=0.1).fit(X, y)
mglearn.plots.plot_2d_separator(svm, X, eps=5)
mglearn.discrete_scatter(X[:, 0], X[:, 1], y)
sv = svm.support_vectors_
sv_labels = svm.dual_coef_.ravel() > 0
mglearn.discrete_scatter(sv[:, 0], sv[:, 1], sv_labels, s=15, markeredgewidth=3)
plt.xlabel("Feature 0")
plt.ylabel("Feature 1")
Text(0, 0.5, 'Feature 1')
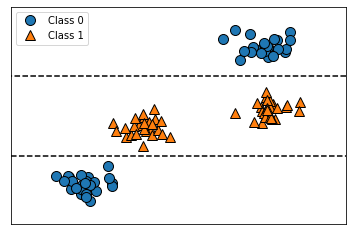
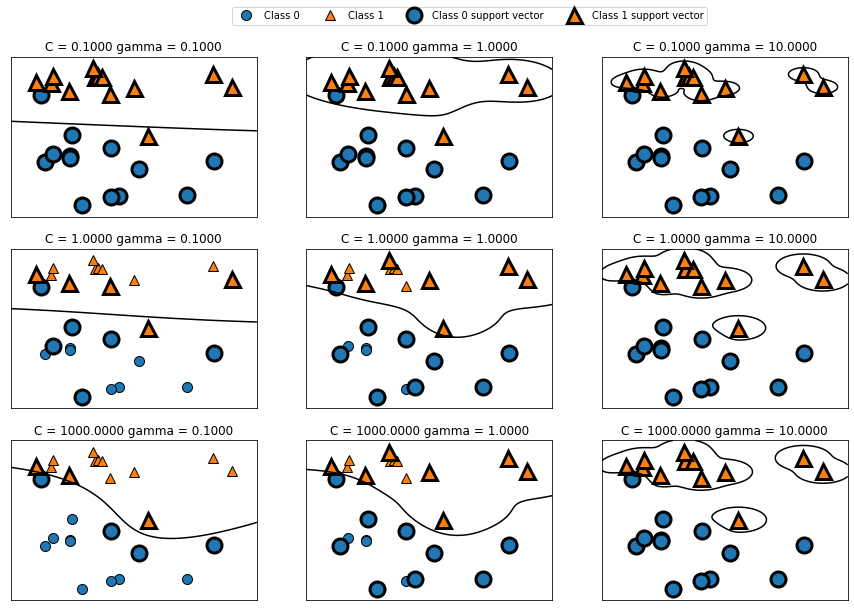
fig, axes = plt.subplots(3, 3, figsize=(15, 10))

for ax, C in zip(axes, [-1, 0, 3]):
    for a, gamma in zip(ax, range(-1, 2)):
        mglearn.plots.plot_svm(log_C=C, log_gamma=gamma, ax=a)

axes[0, 0].legend(["Class 0", "Class 1", "Class 0 support vector", "Class 1 support vector"],
                  ncol=4, loc=(.9, 1.2))
<matplotlib.legend.Legend at 0x7f371bf07950>
X_train, X_test, y_train, y_test = train_test_split(
    cancer.data, cancer.target, random_state=0)

svc = SVC()
svc.fit(X_train, y_train)

print("훈련 세트 정확도: {:.2f}".format(svc.score(X_train, y_train)))
print("테스트 세트 정확도: {:.2f}".format(svc.score(X_test, y_test)))
훈련 세트 정확도: 0.90
테스트 세트 정확도: 0.94
import matplotlib.pyplot as plt

plt.boxplot(X_train, manage_xticks=False)
plt.yscale("symlog")
plt.xlabel("Feature list")
plt.ylabel("Feature magnitude")
---------------------------------------------------------------------------

TypeError                                 Traceback (most recent call last)

<ipython-input-30-c1aa60b2530e> in <module>()
      1 import matplotlib.pyplot as plt
      2
----> 3 plt.boxplot(X_train, manage_xticks=False)
      4 plt.yscale("symlog")
      5 plt.xlabel("Feature list")


TypeError: boxplot() got an unexpected keyword argument 'manage_xticks'
display(mglearn.plots.plot_logistic_regression_graph())

display(mglearn.plots.plot_single_hidden_layer_graph())

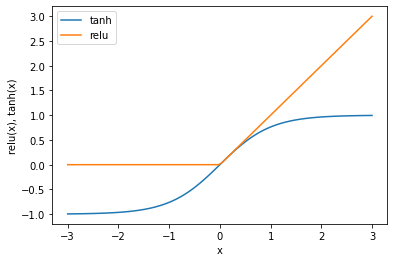
line = np.linspace(-3, 3, 100)
plt.plot(line, np.tanh(line), label="tanh")
plt.plot(line, np.maximum(line, 0), label="relu")
plt.legend(loc="best")
plt.xlabel("x")
plt.ylabel("relu(x), tanh(x)")
Text(0, 0.5, 'relu(x), tanh(x)')
mglearn.plots.plot_two_hidden_layer_graph()

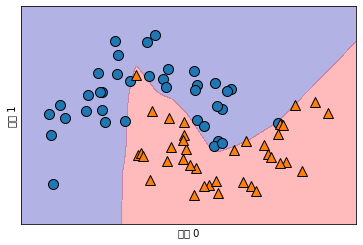
from sklearn.neural_network import MLPClassifier
from sklearn.datasets import make_moons

X, y = make_moons(n_samples=100, noise=0.25, random_state=3)

X_train, X_test, y_train, y_test = train_test_split(X, y, stratify=y,
                                                    random_state=42)

mlp = MLPClassifier(solver='lbfgs', random_state=0).fit(X_train, y_train)
mglearn.plots.plot_2d_separator(mlp, X_train, fill=True, alpha=.3)
mglearn.discrete_scatter(X_train[:, 0], X_train[:, 1], y_train)
plt.xlabel("특성 0")
plt.ylabel("특성 1")
Text(0, 0.5, '특성 1')


/usr/local/lib/python3.7/dist-packages/matplotlib/backends/backend_agg.py:214: RuntimeWarning: Glyph 53945 missing from current font.
  font.set_text(s, 0.0, flags=flags)
/usr/local/lib/python3.7/dist-packages/matplotlib/backends/backend_agg.py:214: RuntimeWarning: Glyph 49457 missing from current font.
  font.set_text(s, 0.0, flags=flags)
/usr/local/lib/python3.7/dist-packages/matplotlib/backends/backend_agg.py:183: RuntimeWarning: Glyph 53945 missing from current font.
  font.set_text(s, 0, flags=flags)
/usr/local/lib/python3.7/dist-packages/matplotlib/backends/backend_agg.py:183: RuntimeWarning: Glyph 49457 missing from current font.
  font.set_text(s, 0, flags=flags)
pip install requests
Requirement already satisfied: requests in /usr/local/lib/python3.7/dist-packages (2.23.0)
Requirement already satisfied: chardet<4,>=3.0.2 in /usr/local/lib/python3.7/dist-packages (from requests) (3.0.4)
Requirement already satisfied: certifi>=2017.4.17 in /usr/local/lib/python3.7/dist-packages (from requests) (2021.5.30)
Requirement already satisfied: urllib3!=1.25.0,!=1.25.1,<1.26,>=1.21.1 in /usr/local/lib/python3.7/dist-packages (from requests) (1.24.3)
Requirement already satisfied: idna<3,>=2.5 in /usr/local/lib/python3.7/dist-packages (from requests) (2.10)
import requests
r = requests.get('https://www.nytimes.com/interactive/2017/06/23/opinion/trumps-lies.html')
print(r.text[0:500])
<!DOCTYPE html>
<!--[if (gt IE 9)|!(IE)]> <!--><html lang="en" class="no-js page-interactive section-opinion page-theme-standard tone-opinion page-interactive-default limit-small layout-xlarge app-interactive" itemid="https://www.nytimes.com/interactive/2017/06/23/opinion/trumps-lies.html" itemtype="http://schema.org/NewsArticle" itemscope xmlns:og="http://opengraphprotocol.org/schema/"><!--<![endif]-->
<!--[if IE 9]> <html lang="en" class="no-js ie9 lt-ie10 page-interactive section-opinion page
pip install BeautifulSoup4
from bs4 import BeautifulSoup
soup = BeautifulSoup(r.text, 'html.parser')
results = soup.find_all('span', attrs={'class':'short-desc'})
len(results)
results[0:3]
results[-1]
first_result = results[0]
first_result
first_result.find('strong')
first_result.find('strong').text
first_result.find('strong').text[0:-1]
first_result.find('strong').text[0:-1] + ', 2017'
records = []
for result in results:
    date = result.find('strong').text[0:-1] + ', 2017'
    lie = result.contents[1][1:-2]
    explanation = result.find('a').text[1:-1]
    url = result.find('a')['href']
    records.append((date, lie, explanation, url))
len(records)
records[0:3]
import pandas as pd
df = pd.DataFrame(records, columns=['date', 'lie', 'explanation', 'url'])
---------------------------------------------------------------------------

NameError                                 Traceback (most recent call last)

<ipython-input-45-339d92375b9d> in <module>()
      1 import pandas as pd
----> 2 df = pd.DataFrame(records, columns=['date', 'lie', 'explanation', 'url'])


NameError: name 'records' is not defined
df.head()
df.tail()
df['date'] = pd.to_datetime(df['date'])
df.head()
df.tail()
import pandas as pd
df = pd.DataFrame(records, columns=['date', 'lie', 'explanation', 'url'])
df['date'] = pd.to_datetime(df['date'])
df.to_csv(r'Local Disk(C:)\Users\Owen_Jeong\Desktop\trump_lies.csv', index=False, encoding='utf-8')

print(df)
---------------------------------------------------------------------------

NameError                                 Traceback (most recent call last)

<ipython-input-46-c45d5ea8a533> in <module>()
      1 import pandas as pd
----> 2 df = pd.DataFrame(records, columns=['date', 'lie', 'explanation', 'url'])
      3 df['date'] = pd.to_datetime(df['date'])
      4 df.to_csv(r'Local Disk(C:)\Users\Owen_Jeong\Desktop\trump_lies.csv', index=False, encoding='utf-8')
      5


NameError: name 'records' is not defined
import requests
r = requests.get('http://alpha.directtrucking.us.com/xyz2099/x_route.php')
print(r.text[0:500])
import mglearn

display(mglearn.plots.plot_logistic_regression_graph())
from sklearn.neural_network import MLPClassifier
from sklearn.datasets import make_moons
import sklearn
from sklearn.model_selecion import train_test_split
import matplotlib.pyplot as plt


X,y = make_moons(n_samples=100, noise=0.25, random_state=3)

X_train, X_test, y_train, y_test = train_test_split(X,y, stratify = y, random_state=42)

mlp = MLPClassifier(solver='lbfgs', random_state=0).fit(X_train, y_train)
mglearn.plots.plot_2d_separator(mlp, X_train, fille=True, alpha=.3)
mgleanr.discrete_scatter(X_train[:.0], X_train[:.1], y_train)

plt.xlable("Feature 0")
plt.ylable("Feature 1")