Matplotlib Note(Python)
import numpy as np
import matplotlib.pyplot as plt
Example plot 1 - pyplot API Style
This is a simple plotting example
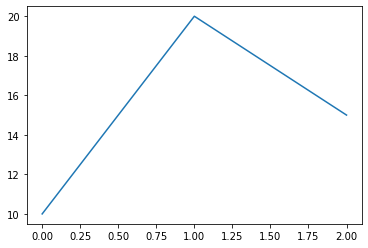
y = np.array([10,20,15])
plt.plot(y)
[<matplotlib.lines.Line2D at 0x7ff06dc00490>]
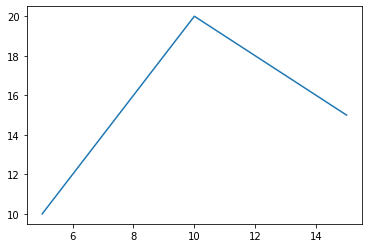
x = np.array([5.,10.,15.])
y = np.array([10.,20.,15.])
plt.plot(x,y)
[<matplotlib.lines.Line2D at 0x7ff06df6a290>]
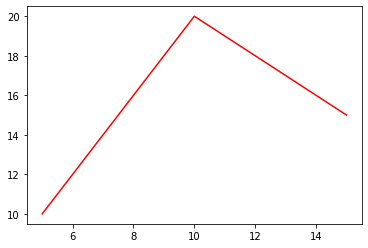
plt.plot(x,y, 'r')
[<matplotlib.lines.Line2D at 0x7ff06d609d10>]
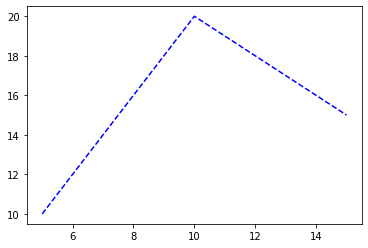
plt.plot(x,y,'b--')
[<matplotlib.lines.Line2D at 0x7ff06d6149d0>]
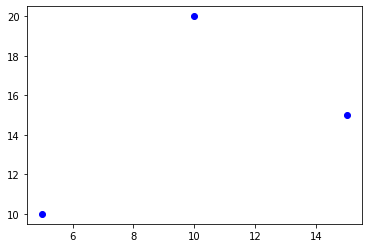
plt.plot(x,y, 'bo')
[<matplotlib.lines.Line2D at 0x7ff06d574a50>]
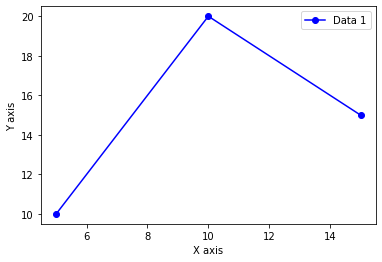
plt.plot(x,y, 'b-o', label='Data 1')
plt.ylabel('Y axis')
plt.xlabel('X axis')
plt.legend()
<matplotlib.legend.Legend at 0x7ff06d4a9250>
Plot Example 2 - Object-Oriented Style
x
array([ 5., 10., 15.])
y
array([10., 20., 15.])
hf = plt.figure()
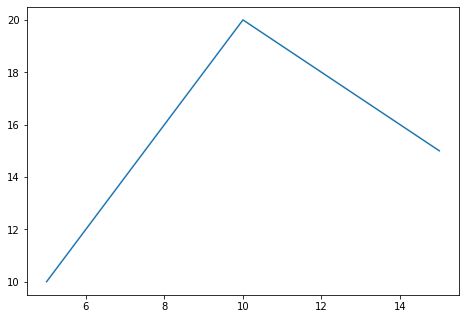
ha = hf.add_axes([0,0,1,1])
ha.plot(x,y)
[<matplotlib.lines.Line2D at 0x7ff06d2ef990>]
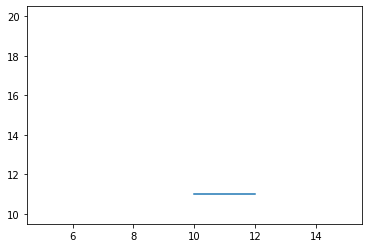
fig, ax = plt.subplots()
line, =ax.plot(x,y)

i = 1.1
x_new = np.array([10,11,12])
y_new = np.array([10,10,10])
line.set_data(x_new,i*y_new)
fig
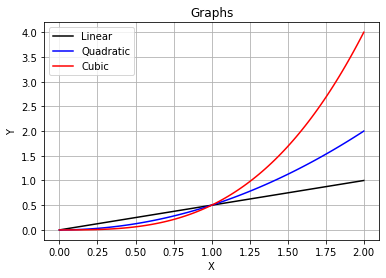
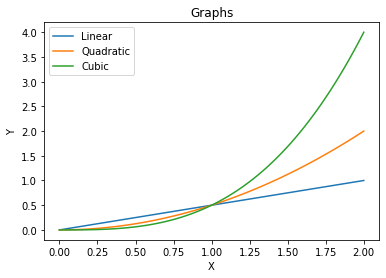
Multiple Line Graphs = Pyplot style
x = np.linspace(0,2,100)
y1 = 0.5*x
y2 = 0.5*x**2
y3 = 0.5*x**3
plt.plot(x,y1,label='Linear')
plt.plot(x,y2,label='Quadratic')
plt.plot(x,y3,label='Cubic')
plt.legend()
plt.ylabel('Y')
plt.xlabel('X')
plt.title('Graphs')
Text(0.5, 1.0, 'Graphs')
Multiple Line Graphs - OOP Style
hf, ha = plt.subplots()
hp1, = ha.plot(x,y1)
hp2, = ha.plot(x,y2)
hp3, = ha.plot(x,y3)
ha.set_ylabel('Y')
ha.set_xlabel('X')
ha.set_title('Graphs')
hp1.set_label('Linear')
hp2.set_label('Quadratic')
hp3.set_label('Cubic')
ha.legend()
<matplotlib.legend.Legend at 0x7ff06d155d90>

hp1.set_color('k')
hp2.set_color('b')
hp3.set_color('r')
ha.legend()
ha.grid()
hf