Pandas Note(Python)
import numpy as np
import pandas as pd
Create Data Frame
data = {'Name':['S1','S2','S3'],
        'Age' :[25, 28, 22],
        'Score': np.array([95,80,75])}
print(data)
{'Name': ['S1', 'S2', 'S3'], 'Age': [25, 28, 22], 'Score': array([95, 80, 75])}
#Save to dataframe
df = pd.DataFrame(data)
print(df)
  Name  Age  Score
0   S1   25     95
1   S2   28     80
2   S3   22     75
# add row names
df = pd.DataFrame(data,index=['row1','row2','row3'])
df
| Name | Age | Score | |
|---|---|---|---|
| row1 | S1 | 25 | 95 |
| row2 | S2 | 28 | 80 |
| row3 | S3 | 22 | 75 |
# list data
data2 = [['S1', 25, 95.],
         ['S2', 28, 80.],
         ['S3', 22, 75.]]
print(data2)
[['S1', 25, 95.0], ['S2', 28, 80.0], ['S3', 22, 75.0]]
# list to dataframe
df = pd.DataFrame(data2, index=['row1','row2','row3'],
                        columns=['Name', 'Age', 'Score'])
df
| Name | Age | Score | |
|---|---|---|---|
| row1 | S1 | 25 | 95.0 |
| row2 | S2 | 28 | 80.0 |
| row3 | S3 | 22 | 75.0 |
Subset Observation
# column observation
df['Name']
row1    S1
row2    S2
row3    S3
Name: Name, dtype: object
df['Age']
row1    25
row2    28
row3    22
Name: Age, dtype: int64
df['Score']
row1    95.0
row2    80.0
row3    75.0
Name: Score, dtype: float64
df[ ['Name','Score'] ]
| Name | Score | |
|---|---|---|
| row1 | S1 | 95.0 |
| row2 | S2 | 80.0 |
| row3 | S3 | 75.0 |
# row observation
df.loc['row1']
Name     S1
Age      25
Score    95
Name: row1, dtype: object
df.loc[['row1','row3']]
| Name | Age | Score | |
|---|---|---|---|
| row1 | S1 | 25 | 95.0 |
| row3 | S3 | 22 | 75.0 |
# row and column observation
df.loc['row1', 'Name']
'S1'
df.loc[:, 'Name']
row1    S1
row2    S2
row3    S3
Name: Name, dtype: object
df.loc[:,['Name','Score']]
| Name | Score | |
|---|---|---|
| row1 | S1 | 95.0 |
| row2 | S2 | 80.0 |
| row3 | S3 | 75.0 |
# indexing/slicing
df.iloc[0,0]
'S1'
df.iloc[:,[0,2]]
| Name | Score | |
|---|---|---|
| row1 | S1 | 95.0 |
| row2 | S2 | 80.0 |
| row3 | S3 | 75.0 |
df.iloc[::2,[0,2]]
| Name | Score | |
|---|---|---|
| row1 | S1 | 95.0 |
| row3 | S3 | 75.0 |
df.iloc[-1, :]
Name     S3
Age      22
Score    75
Name: row3, dtype: object
df.iloc[-1::-1, :]
| Name | Age | Score | |
|---|---|---|---|
| row3 | S3 | 22 | 75.0 |
| row2 | S2 | 28 | 80.0 |
| row1 | S1 | 25 | 95.0 |
# head and tail
df.head()
| Name | Age | Score | |
|---|---|---|---|
| row1 | S1 | 25 | 95.0 |
| row2 | S2 | 28 | 80.0 |
| row3 | S3 | 22 | 75.0 |
df.head(1)
| Name | Age | Score | |
|---|---|---|---|
| row1 | S1 | 25 | 95.0 |
df.tail(1)
| Name | Age | Score | |
|---|---|---|---|
| row3 | S3 | 22 | 75.0 |
Summarizing Data
df.info()
<class 'pandas.core.frame.DataFrame'>
Index: 3 entries, row1 to row3
Data columns (total 3 columns):
 #   Column  Non-Null Count  Dtype
---  ------  --------------  -----
 0   Name    3 non-null      object
 1   Age     3 non-null      int64
 2   Score   3 non-null      float64
dtypes: float64(1), int64(1), object(1)
memory usage: 176.0+ bytes
df.describe()
| Age | Score | |
|---|---|---|
| count | 3.0 | 3.000000 |
| mean | 25.0 | 83.333333 |
| std | 3.0 | 10.408330 |
| min | 22.0 | 75.000000 |
| 25% | 23.5 | 77.500000 |
| 50% | 25.0 | 80.000000 |
| 75% | 26.5 | 87.500000 |
| max | 28.0 | 95.000000 |
# nunique() usage
df2 = df.copy()
df2
| Name | Age | Score | |
|---|---|---|---|
| row1 | S1 | 25 | 95.0 |
| row2 | S2 | 28 | 80.0 |
| row3 | S3 | 22 | 75.0 |
df2.loc['row2', 'Score']=np.NaN
df2
| Name | Age | Score | |
|---|---|---|---|
| row1 | S1 | 25 | 95.0 |
| row2 | S2 | 28 | NaN |
| row3 | S3 | 22 | 75.0 |
df2.nunique()
Name     3
Age      3
Score    2
dtype: int64
df2
| Name | Age | Score | |
|---|---|---|---|
| row1 | S1 | 25 | 95.0 |
| row2 | S2 | 28 | NaN |
| row3 | S3 | 22 | 75.0 |
df2['Score'].nunique()
2
df2['Score'].value_counts()
75.0    1
95.0    1
Name: Score, dtype: int64
df['Score'].sum()
250.0
df.max()
Name     S3
Age      28
Score    95
dtype: object
df['Score'].std()
10.408329997330664
Column Exchange
df4 = df.copy()
df4
| Name | Age | Score | |
|---|---|---|---|
| row1 | S1 | 25 | 95.0 |
| row2 | S2 | 28 | 80.0 |
| row3 | S3 | 22 | 75.0 |
df4 = df4.iloc[:,[0,2,1]]
df4
| Name | Score | Age | |
|---|---|---|---|
| row1 | S1 | 95.0 | 25 |
| row2 | S2 | 80.0 | 28 |
| row3 | S3 | 75.0 | 22 |
Logical Operation
data = {
        'Class':['A','B','C','A','B','C','C'],
        'Name' :['S1','S2','S3','S4','S5','S6','S7'],
        'Age'  :[20,19,21,22,24,25,26],
        'Score':[90.,95.,75.,80,70,85,90],
}
df = pd.DataFrame(data)
df
| Class | Name | Age | Score | |
|---|---|---|---|---|
| 0 | A | S1 | 20 | 90.0 |
| 1 | B | S2 | 19 | 95.0 |
| 2 | C | S3 | 21 | 75.0 |
| 3 | A | S4 | 22 | 80.0 |
| 4 | B | S5 | 24 | 70.0 |
| 5 | C | S6 | 25 | 85.0 |
| 6 | C | S7 | 26 | 90.0 |
df['Score'] >= 80
0     True
1     True
2    False
3     True
4    False
5     True
6     True
Name: Score, dtype: bool
df.loc[ df['Score'] >= 80 ]
| Class | Name | Age | Score | |
|---|---|---|---|---|
| 0 | A | S1 | 20 | 90.0 |
| 1 | B | S2 | 19 | 95.0 |
| 3 | A | S4 | 22 | 80.0 |
| 5 | C | S6 | 25 | 85.0 |
| 6 | C | S7 | 26 | 90.0 |
df.loc[ df['Score'] >= 80, 'Name' ]
0    S1
1    S2
3    S4
5    S6
6    S7
Name: Name, dtype: object
df.loc[ df['Score'] >= 80, ['Name', 'Age'] ]
| Name | Age | |
|---|---|---|
| 0 | S1 | 20 |
| 1 | S2 | 19 |
| 3 | S4 | 22 |
| 5 | S6 | 25 |
| 6 | S7 | 26 |
df
| Class | Name | Age | Score | |
|---|---|---|---|---|
| 0 | A | S1 | 20 | 90.0 |
| 1 | B | S2 | 19 | 95.0 |
| 2 | C | S3 | 21 | 75.0 |
| 3 | A | S4 | 22 | 80.0 |
| 4 | B | S5 | 24 | 70.0 |
| 5 | C | S6 | 25 | 85.0 |
| 6 | C | S7 | 26 | 90.0 |
df['Result']='NONE'
df
| Class | Name | Age | Score | Result | |
|---|---|---|---|---|---|
| 0 | A | S1 | 20 | 90.0 | NONE |
| 1 | B | S2 | 19 | 95.0 | NONE |
| 2 | C | S3 | 21 | 75.0 | NONE |
| 3 | A | S4 | 22 | 80.0 | NONE |
| 4 | B | S5 | 24 | 70.0 | NONE |
| 5 | C | S6 | 25 | 85.0 | NONE |
| 6 | C | S7 | 26 | 90.0 | NONE |
df.loc[ df['Score'] >= 80, 'Result'] = 'Pass'
df
| Class | Name | Age | Score | Result | |
|---|---|---|---|---|---|
| 0 | A | S1 | 20 | 90.0 | Pass |
| 1 | B | S2 | 19 | 95.0 | Pass |
| 2 | C | S3 | 21 | 75.0 | NONE |
| 3 | A | S4 | 22 | 80.0 | Pass |
| 4 | B | S5 | 24 | 70.0 | NONE |
| 5 | C | S6 | 25 | 85.0 | Pass |
| 6 | C | S7 | 26 | 90.0 | Pass |
df.loc[ df['Score'] < 80, 'Result'] = 'Fail'
df
| Class | Name | Age | Score | Result | |
|---|---|---|---|---|---|
| 0 | A | S1 | 20 | 90.0 | Pass |
| 1 | B | S2 | 19 | 95.0 | Pass |
| 2 | C | S3 | 21 | 75.0 | Fail |
| 3 | A | S4 | 22 | 80.0 | Pass |
| 4 | B | S5 | 24 | 70.0 | Fail |
| 5 | C | S6 | 25 | 85.0 | Pass |
| 6 | C | S7 | 26 | 90.0 | Pass |
df['Result'] == 'Pass'
0     True
1     True
2    False
3     True
4    False
5     True
6     True
Name: Result, dtype: bool
idx =  (df['Result'] == 'Pass')
df.loc[idx]
| Class | Name | Age | Score | Result | |
|---|---|---|---|---|---|
| 0 | A | S1 | 20 | 90.0 | Pass |
| 1 | B | S2 | 19 | 95.0 | Pass |
| 3 | A | S4 | 22 | 80.0 | Pass |
| 5 | C | S6 | 25 | 85.0 | Pass |
| 6 | C | S7 | 26 | 90.0 | Pass |
df.loc[ idx ].sort_values('Score')
| Class | Name | Age | Score | Result | |
|---|---|---|---|---|---|
| 3 | A | S4 | 22 | 80.0 | Pass |
| 5 | C | S6 | 25 | 85.0 | Pass |
| 0 | A | S1 | 20 | 90.0 | Pass |
| 6 | C | S7 | 26 | 90.0 | Pass |
| 1 | B | S2 | 19 | 95.0 | Pass |
df_sorted = (df.loc[ idx ].sort_values('Score', ascending=False))
df_sorted
| Class | Name | Age | Score | Result | |
|---|---|---|---|---|---|
| 1 | B | S2 | 19 | 95.0 | Pass |
| 0 | A | S1 | 20 | 90.0 | Pass |
| 6 | C | S7 | 26 | 90.0 | Pass |
| 5 | C | S6 | 25 | 85.0 | Pass |
| 3 | A | S4 | 22 | 80.0 | Pass |
df_sorted.to_excel('data_sorted.xlsx', index=False)
df_import = pd.read_excel('data_sorted.xlsx')
df_import
| Class | Name | Age | Score | Result | |
|---|---|---|---|---|---|
| 0 | B | S2 | 19 | 95 | Pass |
| 1 | A | S1 | 20 | 90 | Pass |
| 2 | C | S7 | 26 | 90 | Pass |
| 3 | C | S6 | 25 | 85 | Pass |
| 4 | A | S4 | 22 | 80 | Pass |
Grouping
df.groupby(by='Class').mean()
| Age | Score | |
|---|---|---|
| Class | ||
| A | 21.0 | 85.000000 |
| B | 21.5 | 82.500000 |
| C | 24.0 | 83.333333 |
df.groupby(by='Class').count()
| Name | Age | Score | Result | |
|---|---|---|---|---|
| Class | ||||
| A | 2 | 2 | 2 | 2 |
| B | 2 | 2 | 2 | 2 |
| C | 3 | 3 | 3 | 3 |
df.groupby(by='Class').std()
| Age | Score | |
|---|---|---|
| Class | ||
| A | 1.414214 | 7.071068 |
| B | 3.535534 | 17.677670 |
| C | 2.645751 | 7.637626 |
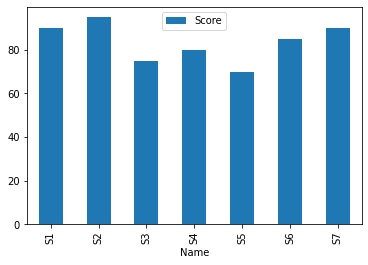
Plotting
df.plot.bar('Name','Score')
<matplotlib.axes._subplots.AxesSubplot at 0x7f1f1e358110>
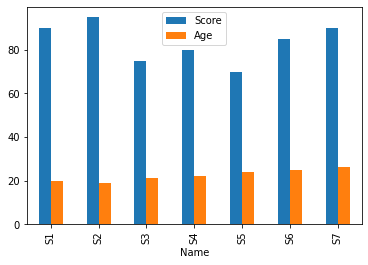
df.plot.bar('Name',['Score','Age'])
<matplotlib.axes._subplots.AxesSubplot at 0x7f1f1e047450>
Handling Missing Data
df.loc[ [0,2], 'Score'] = np.NaN
df
| Class | Name | Age | Score | Result | |
|---|---|---|---|---|---|
| 0 | A | S1 | 20 | NaN | Pass |
| 1 | B | S2 | 19 | 95.0 | Pass |
| 2 | C | S3 | 21 | NaN | Fail |
| 3 | A | S4 | 22 | 80.0 | Pass |
| 4 | B | S5 | 24 | 70.0 | Fail |
| 5 | C | S6 | 25 | 85.0 | Pass |
| 6 | C | S7 | 26 | 90.0 | Pass |
df.isnull()
| Class | Name | Age | Score | Result | |
|---|---|---|---|---|---|
| 0 | False | False | False | True | False |
| 1 | False | False | False | False | False |
| 2 | False | False | False | True | False |
| 3 | False | False | False | False | False |
| 4 | False | False | False | False | False |
| 5 | False | False | False | False | False |
| 6 | False | False | False | False | False |
df.dropna()
| Class | Name | Age | Score | Result | |
|---|---|---|---|---|---|
| 1 | B | S2 | 19 | 95.0 | Pass |
| 3 | A | S4 | 22 | 80.0 | Pass |
| 4 | B | S5 | 24 | 70.0 | Fail |
| 5 | C | S6 | 25 | 85.0 | Pass |
| 6 | C | S7 | 26 | 90.0 | Pass |
value = 0
df.fillna(value)
| Class | Name | Age | Score | Result | |
|---|---|---|---|---|---|
| 0 | A | S1 | 20 | 0.0 | Pass |
| 1 | B | S2 | 19 | 95.0 | Pass |
| 2 | C | S3 | 21 | 0.0 | Fail |
| 3 | A | S4 | 22 | 80.0 | Pass |
| 4 | B | S5 | 24 | 70.0 | Fail |
| 5 | C | S6 | 25 | 85.0 | Pass |
| 6 | C | S7 | 26 | 90.0 | Pass |
# replace
df.replace(np.nan, -1)
| Class | Name | Age | Score | Result | |
|---|---|---|---|---|---|
| 0 | A | S1 | 20 | -1.0 | Pass |
| 1 | B | S2 | 19 | 95.0 | Pass |
| 2 | C | S3 | 21 | -1.0 | Fail |
| 3 | A | S4 | 22 | 80.0 | Pass |
| 4 | B | S5 | 24 | 70.0 | Fail |
| 5 | C | S6 | 25 | 85.0 | Pass |
| 6 | C | S7 | 26 | 90.0 | Pass |
#interpolate
df.interpolate()
| Class | Name | Age | Score | Result | |
|---|---|---|---|---|---|
| 0 | A | S1 | 20 | NaN | Pass |
| 1 | B | S2 | 19 | 95.0 | Pass |
| 2 | C | S3 | 21 | 87.5 | Fail |
| 3 | A | S4 | 22 | 80.0 | Pass |
| 4 | B | S5 | 24 | 70.0 | Fail |
| 5 | C | S6 | 25 | 85.0 | Pass |
| 6 | C | S7 | 26 | 90.0 | Pass |
Function
def add_one(x):
  return x+1
add_one(10)
11
df
| Class | Name | Age | Score | Result | |
|---|---|---|---|---|---|
| 0 | A | S1 | 20 | NaN | Pass |
| 1 | B | S2 | 19 | 95.0 | Pass |
| 2 | C | S3 | 21 | NaN | Fail |
| 3 | A | S4 | 22 | 80.0 | Pass |
| 4 | B | S5 | 24 | 70.0 | Fail |
| 5 | C | S6 | 25 | 85.0 | Pass |
| 6 | C | S7 | 26 | 90.0 | Pass |
df['Age'].apply(add_one)
0    21
1    20
2    22
3    23
4    25
5    26
6    27
Name: Age, dtype: int64
df['Score'].apply(np.square)
0       NaN
1    9025.0
2       NaN
3    6400.0
4    4900.0
5    7225.0
6    8100.0
Name: Score, dtype: float64
Regular Expression
df.filter(regex='[NR]')
| Name | Result | |
|---|---|---|
| 0 | S1 | Pass |
| 1 | S2 | Pass |
| 2 | S3 | Fail |
| 3 | S4 | Pass |
| 4 | S5 | Fail |
| 5 | S6 | Pass |
| 6 | S7 | Pass |
df.filter(regex='[NSR]')
| Name | Score | Result | |
|---|---|---|---|
| 0 | S1 | NaN | Pass |
| 1 | S2 | 95.0 | Pass |
| 2 | S3 | NaN | Fail |
| 3 | S4 | 80.0 | Pass |
| 4 | S5 | 70.0 | Fail |
| 5 | S6 | 85.0 | Pass |
| 6 | S7 | 90.0 | Pass |
Combine Data Frames
df_vertical = pd.concat([df,df])
df_vertical
| Class | Name | Age | Score | Result | |
|---|---|---|---|---|---|
| 0 | A | S1 | 20 | NaN | Pass |
| 1 | B | S2 | 19 | 95.0 | Pass |
| 2 | C | S3 | 21 | NaN | Fail |
| 3 | A | S4 | 22 | 80.0 | Pass |
| 4 | B | S5 | 24 | 70.0 | Fail |
| 5 | C | S6 | 25 | 85.0 | Pass |
| 6 | C | S7 | 26 | 90.0 | Pass |
| 0 | A | S1 | 20 | NaN | Pass |
| 1 | B | S2 | 19 | 95.0 | Pass |
| 2 | C | S3 | 21 | NaN | Fail |
| 3 | A | S4 | 22 | 80.0 | Pass |
| 4 | B | S5 | 24 | 70.0 | Fail |
| 5 | C | S6 | 25 | 85.0 | Pass |
| 6 | C | S7 | 26 | 90.0 | Pass |
df_horizontal = pd.concat([df,df], axis=1)
df_horizontal
| Class | Name | Age | Score | Result | Class | Name | Age | Score | Result | |
|---|---|---|---|---|---|---|---|---|---|---|
| 0 | A | S1 | 20 | NaN | Pass | A | S1 | 20 | NaN | Pass |
| 1 | B | S2 | 19 | 95.0 | Pass | B | S2 | 19 | 95.0 | Pass |
| 2 | C | S3 | 21 | NaN | Fail | C | S3 | 21 | NaN | Fail |
| 3 | A | S4 | 22 | 80.0 | Pass | A | S4 | 22 | 80.0 | Pass |
| 4 | B | S5 | 24 | 70.0 | Fail | B | S5 | 24 | 70.0 | Fail |
| 5 | C | S6 | 25 | 85.0 | Pass | C | S6 | 25 | 85.0 | Pass |
| 6 | C | S7 | 26 | 90.0 | Pass | C | S7 | 26 | 90.0 | Pass |
File I/O
# output to excel
df.to_excel('data_excel.xlsx', index=False)
# output to text
df.to_csv('data_text.txt', sep='\t', index=False)
#output to pickle
df.to_pickle('data_pickle.pkl')
# read in excel file
df_read_excel = pd.read_excel('data_excel.xlsx')
df_read_excel
| Class | Name | Age | Score | Result | |
|---|---|---|---|---|---|
| 0 | A | S1 | 20 | NaN | Pass |
| 1 | B | S2 | 19 | 95.0 | Pass |
| 2 | C | S3 | 21 | NaN | Fail |
| 3 | A | S4 | 22 | 80.0 | Pass |
| 4 | B | S5 | 24 | 70.0 | Fail |
| 5 | C | S6 | 25 | 85.0 | Pass |
| 6 | C | S7 | 26 | 90.0 | Pass |
# read in text file
pd.read_csv('data_text.txt',delimiter='\t')
| Class | Name | Age | Score | Result | |
|---|---|---|---|---|---|
| 0 | A | S1 | 20 | NaN | Pass |
| 1 | B | S2 | 19 | 95.0 | Pass |
| 2 | C | S3 | 21 | NaN | Fail |
| 3 | A | S4 | 22 | 80.0 | Pass |
| 4 | B | S5 | 24 | 70.0 | Fail |
| 5 | C | S6 | 25 | 85.0 | Pass |
| 6 | C | S7 | 26 | 90.0 | Pass |
#read in pickle file
pd.read_pickle('data_pickle.pkl')
| Class | Name | Age | Score | Result | |
|---|---|---|---|---|---|
| 0 | A | S1 | 20 | NaN | Pass |
| 1 | B | S2 | 19 | 95.0 | Pass |
| 2 | C | S3 | 21 | NaN | Fail |
| 3 | A | S4 | 22 | 80.0 | Pass |
| 4 | B | S5 | 24 | 70.0 | Fail |
| 5 | C | S6 | 25 | 85.0 | Pass |
| 6 | C | S7 | 26 | 90.0 | Pass |