Valuation Analysis - NIKE
import yfinance as yf
import pandas as pd
import datetime

# Show full numbers instead of scientific notation
pd.options.display.float_format = '{:,.0f}'.format

ticker = yf.Ticker("NKE")
# - income statement
pd.set_option('display.max_rows', None)
balance_sheet_df = ticker.quarterly_balance_sheet
balance_sheet_df
| 2026-02-28 | 2025-11-30 | 2025-08-31 | 2025-05-31 | 2025-02-28 | 2024-11-30 | |
|---|---|---|---|---|---|---|
| Ordinary Shares Number | 1,480,000,000 | 1,479,887,752 | 1,476,903,492 | 1,476,000,000 | 1,476,887,752 | NaN |
| Share Issued | 1,480,000,000 | 1,479,887,752 | 1,476,903,492 | 1,476,000,000 | 1,476,887,752 | NaN |
| Net Debt | 1,369,000,000 | 1,041,000,000 | 976,000,000 | 502,000,000 | 359,000,000 | NaN |
| Total Debt | 11,178,000,000 | 11,282,000,000 | 11,061,000,000 | 11,018,000,000 | 11,911,000,000 | NaN |
| Tangible Book Value | 13,591,000,000 | 13,586,000,000 | 12,969,000,000 | 12,714,000,000 | 13,509,000,000 | NaN |
| Invested Capital | 22,119,000,000 | 22,100,000,000 | 21,468,000,000 | 21,179,000,000 | 22,967,000,000 | NaN |
| Working Capital | 12,346,000,000 | 12,375,000,000 | 12,987,000,000 | 12,796,000,000 | 13,386,000,000 | NaN |
| Net Tangible Assets | 13,591,000,000 | 13,586,000,000 | 12,969,000,000 | 12,714,000,000 | 13,509,000,000 | NaN |
| Capital Lease Obligations | 3,149,000,000 | 3,267,000,000 | 3,061,000,000 | 3,052,000,000 | 2,951,000,000 | NaN |
| Common Stock Equity | 14,090,000,000 | 14,085,000,000 | 13,468,000,000 | 13,213,000,000 | 14,007,000,000 | NaN |
| Total Capitalization | 21,120,000,000 | 21,101,000,000 | 21,464,000,000 | 21,174,000,000 | 21,963,000,000 | NaN |
| Total Equity Gross Minority Interest | 14,090,000,000 | 14,085,000,000 | 13,468,000,000 | 13,213,000,000 | 14,007,000,000 | NaN |
| Stockholders Equity | 14,090,000,000 | 14,085,000,000 | 13,468,000,000 | 13,213,000,000 | 14,007,000,000 | NaN |
| Gains Losses Not Affecting Retained Earnings | -207,000,000 | -104,000,000 | -308,000,000 | -258,000,000 | 263,000,000 | NaN |
| Other Equity Adjustments | -207,000,000 | -104,000,000 | -308,000,000 | -258,000,000 | 263,000,000 | NaN |
| Retained Earnings | -610,000,000 | -519,000,000 | -700,000,000 | -727,000,000 | -175,000,000 | NaN |
| Additional Paid In Capital | 14,904,000,000 | 14,705,000,000 | 14,473,000,000 | 14,195,000,000 | 13,916,000,000 | NaN |
| Capital Stock | 3,000,000 | 3,000,000 | 3,000,000 | 3,000,000 | 3,000,000 | NaN |
| Common Stock | 3,000,000 | 3,000,000 | 3,000,000 | 3,000,000 | 3,000,000 | NaN |
| Total Liabilities Net Minority Interest | 22,974,000,000 | 23,702,000,000 | 23,866,000,000 | 23,366,000,000 | 23,786,000,000 | NaN |
| Total Non Current Liabilities Net Minority Interest | 12,136,000,000 | 12,062,000,000 | 12,955,000,000 | 12,800,000,000 | 12,563,000,000 | NaN |
| Other Non Current Liabilities | 2,450,000,000 | 2,292,000,000 | 2,404,000,000 | 2,289,000,000 | 2,130,000,000 | NaN |
| Preferred Securities Outside Stock Equity | 0 | 0 | 0 | 0 | 0 | NaN |
| Long Term Debt And Capital Lease Obligation | 9,686,000,000 | 9,770,000,000 | 10,551,000,000 | 10,511,000,000 | 10,433,000,000 | NaN |
| Long Term Capital Lease Obligation | 2,656,000,000 | 2,754,000,000 | 2,555,000,000 | 2,550,000,000 | 2,477,000,000 | NaN |
| Long Term Debt | 7,030,000,000 | 7,016,000,000 | 7,996,000,000 | 7,961,000,000 | 7,956,000,000 | NaN |
| Current Liabilities | 10,838,000,000 | 11,640,000,000 | 10,911,000,000 | 10,566,000,000 | 11,223,000,000 | NaN |
| Current Debt And Capital Lease Obligation | 1,492,000,000 | 1,512,000,000 | 510,000,000 | 507,000,000 | 1,478,000,000 | NaN |
| Current Capital Lease Obligation | 493,000,000 | 513,000,000 | 506,000,000 | 502,000,000 | 474,000,000 | NaN |
| Current Debt | 999,000,000 | 999,000,000 | 4,000,000 | 5,000,000 | 1,004,000,000 | NaN |
| Other Current Borrowings | 999,000,000 | 999,000,000 | NaN | NaN | 1,000,000,000 | 1,000,000,000 |
| Current Notes Payable | 0 | 0 | 4,000,000 | 5,000,000 | 4,000,000 | NaN |
| Pensionand Other Post Retirement Benefit Plans Current | 1,544,000,000 | 1,236,000,000 | 1,244,000,000 | 1,726,000,000 | 1,708,000,000 | NaN |
| Current Provisions | 1,658,000,000 | 1,748,000,000 | 1,788,000,000 | 1,834,000,000 | 1,682,000,000 | NaN |
| Payables And Accrued Expenses | 6,144,000,000 | 7,144,000,000 | 7,369,000,000 | 6,499,000,000 | 6,355,000,000 | NaN |
| Current Accrued Expenses | 2,365,000,000 | 2,320,000,000 | 2,292,000,000 | 1,753,000,000 | 1,917,000,000 | NaN |
| Payables | 3,779,000,000 | 4,824,000,000 | 5,077,000,000 | 4,746,000,000 | 4,438,000,000 | NaN |
| Dividends Payable | 616,000,000 | 615,000,000 | 599,000,000 | 598,000,000 | 598,000,000 | NaN |
| Total Tax Payable | 275,000,000 | 492,000,000 | 706,000,000 | 669,000,000 | 734,000,000 | NaN |
| Income Tax Payable | 275,000,000 | 492,000,000 | 706,000,000 | 669,000,000 | 734,000,000 | NaN |
| Accounts Payable | 2,888,000,000 | 3,717,000,000 | 3,772,000,000 | 3,479,000,000 | 3,106,000,000 | NaN |
| Total Assets | 37,064,000,000 | 37,787,000,000 | 37,334,000,000 | 36,579,000,000 | 37,793,000,000 | NaN |
| Total Non Current Assets | 13,880,000,000 | 13,772,000,000 | 13,436,000,000 | 13,217,000,000 | 13,184,000,000 | NaN |
| Other Non Current Assets | 5,729,000,000 | 5,536,000,000 | 5,349,000,000 | 5,178,000,000 | 5,355,000,000 | NaN |
| Goodwill And Other Intangible Assets | 499,000,000 | 499,000,000 | 499,000,000 | 499,000,000 | 498,000,000 | NaN |
| Other Intangible Assets | 259,000,000 | 259,000,000 | 259,000,000 | 259,000,000 | 259,000,000 | NaN |
| Goodwill | 240,000,000 | 240,000,000 | 240,000,000 | 240,000,000 | 239,000,000 | NaN |
| Net PPE | 7,652,000,000 | 7,737,000,000 | 7,588,000,000 | 7,540,000,000 | 7,331,000,000 | NaN |
| Accumulated Depreciation | NaN | NaN | NaN | -6,104,000,000 | NaN | NaN |
| Gross PPE | 7,652,000,000 | 7,737,000,000 | 7,588,000,000 | 13,644,000,000 | 7,331,000,000 | NaN |
| Leases | NaN | NaN | NaN | 2,037,000,000 | NaN | NaN |
| Construction In Progress | NaN | NaN | NaN | 404,000,000 | NaN | NaN |
| Other Properties | 7,652,000,000 | 7,737,000,000 | 7,588,000,000 | 2,712,000,000 | 7,331,000,000 | NaN |
| Machinery Furniture Equipment | NaN | NaN | NaN | 4,647,000,000 | NaN | NaN |
| Buildings And Improvements | NaN | NaN | NaN | 3,510,000,000 | NaN | NaN |
| Land And Improvements | NaN | NaN | NaN | 334,000,000 | NaN | NaN |
| Properties | NaN | NaN | NaN | 0 | NaN | NaN |
| Current Assets | 23,184,000,000 | 24,015,000,000 | 23,898,000,000 | 23,362,000,000 | 24,609,000,000 | NaN |
| Other Current Assets | 2,271,000,000 | 2,206,000,000 | 2,247,000,000 | 2,005,000,000 | 2,186,000,000 | NaN |
| Inventory | 7,487,000,000 | 7,726,000,000 | 8,114,000,000 | 7,489,000,000 | 7,539,000,000 | NaN |
| Finished Goods | 7,487,000,000 | 7,726,000,000 | 8,114,000,000 | 7,489,000,000 | 7,539,000,000 | NaN |
| Receivables | 5,369,000,000 | 5,738,000,000 | 4,962,000,000 | 4,717,000,000 | 4,491,000,000 | NaN |
| Accounts Receivable | 5,369,000,000 | 5,738,000,000 | 4,962,000,000 | 4,717,000,000 | 4,491,000,000 | NaN |
| Allowance For Doubtful Accounts Receivable | NaN | NaN | NaN | -27,000,000 | NaN | NaN |
| Gross Accounts Receivable | NaN | NaN | NaN | 4,744,000,000 | NaN | NaN |
| Cash Cash Equivalents And Short Term Investments | 8,057,000,000 | 8,345,000,000 | 8,575,000,000 | 9,151,000,000 | 10,393,000,000 | NaN |
| Other Short Term Investments | 1,397,000,000 | 1,371,000,000 | 1,551,000,000 | 1,687,000,000 | 1,792,000,000 | NaN |
| Cash And Cash Equivalents | 6,660,000,000 | 6,974,000,000 | 7,024,000,000 | 7,464,000,000 | 8,601,000,000 | NaN |
| Cash Equivalents | 4,967,000,000 | 5,216,000,000 | 5,615,000,000 | 6,243,000,000 | 7,263,000,000 | NaN |
| Cash Financial | 1,693,000,000 | 1,758,000,000 | 1,409,000,000 | 1,221,000,000 | 1,338,000,000 | NaN |
cash_flow_df = ticker.cashflow
cash_flow_df
| 2025-05-31 | 2024-05-31 | 2023-05-31 | 2022-05-31 | |
|---|---|---|---|---|
| Free Cash Flow | 3,268,000,000 | 6,617,000,000 | 4,872,000,000 | 4,430,000,000 |
| Repurchase Of Capital Stock | -2,985,000,000 | -4,250,000,000 | -5,480,000,000 | -4,014,000,000 |
| Repayment Of Debt | -1,000,000,000 | 0 | -500,000,000 | 0 |
| Issuance Of Debt | NaN | NaN | NaN | 0 |
| Capital Expenditure | -430,000,000 | -812,000,000 | -969,000,000 | -758,000,000 |
| Interest Paid Supplemental Data | 389,000,000 | 381,000,000 | 347,000,000 | 290,000,000 |
| Income Tax Paid Supplemental Data | 1,226,000,000 | 1,299,000,000 | 1,517,000,000 | 1,231,000,000 |
| End Cash Position | 7,464,000,000 | 9,860,000,000 | 7,441,000,000 | 8,574,000,000 |
| Beginning Cash Position | 9,860,000,000 | 7,441,000,000 | 8,574,000,000 | 9,889,000,000 |
| Effect Of Exchange Rate Changes | 1,000,000 | -16,000,000 | -91,000,000 | -143,000,000 |
| Changes In Cash | -2,397,000,000 | 2,435,000,000 | -1,042,000,000 | -1,172,000,000 |
| Financing Cash Flow | -5,820,000,000 | -5,888,000,000 | -7,447,000,000 | -4,836,000,000 |
| Cash Flow From Continuing Financing Activities | -5,820,000,000 | -5,888,000,000 | -7,447,000,000 | -4,836,000,000 |
| Net Other Financing Charges | -85,000,000 | -136,000,000 | -102,000,000 | -151,000,000 |
| Proceeds From Stock Option Exercised | 551,000,000 | 667,000,000 | 651,000,000 | 1,151,000,000 |
| Cash Dividends Paid | -2,300,000,000 | -2,169,000,000 | -2,012,000,000 | -1,837,000,000 |
| Common Stock Dividend Paid | -2,300,000,000 | -2,169,000,000 | -2,012,000,000 | -1,837,000,000 |
| Net Common Stock Issuance | -2,985,000,000 | -4,250,000,000 | -5,480,000,000 | -4,014,000,000 |
| Common Stock Payments | -2,985,000,000 | -4,250,000,000 | -5,480,000,000 | -4,014,000,000 |
| Net Issuance Payments Of Debt | -1,001,000,000 | 0 | -504,000,000 | 15,000,000 |
| Net Short Term Debt Issuance | -1,000,000 | 0 | -4,000,000 | 15,000,000 |
| Net Long Term Debt Issuance | -1,000,000,000 | 0 | -500,000,000 | 0 |
| Long Term Debt Payments | -1,000,000,000 | 0 | -500,000,000 | 0 |
| Long Term Debt Issuance | NaN | NaN | NaN | 0 |
| Investing Cash Flow | -275,000,000 | 894,000,000 | 564,000,000 | -1,524,000,000 |
| Cash Flow From Continuing Investing Activities | -275,000,000 | 894,000,000 | 564,000,000 | -1,524,000,000 |
| Net Other Investing Changes | 8,000,000 | -15,000,000 | 52,000,000 | -19,000,000 |
| Net Investment Purchase And Sale | 147,000,000 | 1,721,000,000 | 1,481,000,000 | -747,000,000 |
| Sale Of Investment | 3,381,000,000 | 6,488,000,000 | 7,540,000,000 | 12,166,000,000 |
| Purchase Of Investment | -3,234,000,000 | -4,767,000,000 | -6,059,000,000 | -12,913,000,000 |
| Net PPE Purchase And Sale | -430,000,000 | -812,000,000 | -969,000,000 | -758,000,000 |
| Purchase Of PPE | -430,000,000 | -812,000,000 | -969,000,000 | -758,000,000 |
| Operating Cash Flow | 3,698,000,000 | 7,429,000,000 | 5,841,000,000 | 5,188,000,000 |
| Cash Flow From Continuing Operating Activities | 3,698,000,000 | 7,429,000,000 | 5,841,000,000 | 5,188,000,000 |
| Change In Working Capital | -787,000,000 | 716,000,000 | -513,000,000 | -1,660,000,000 |
| Change In Payables And Accrued Expense | -426,000,000 | 397,000,000 | -225,000,000 | 1,365,000,000 |
| Change In Payable | -426,000,000 | 397,000,000 | -225,000,000 | 1,365,000,000 |
| Change In Account Payable | -426,000,000 | 397,000,000 | -225,000,000 | 1,365,000,000 |
| Change In Prepaid Assets | -224,000,000 | -260,000,000 | -644,000,000 | -845,000,000 |
| Change In Inventory | 120,000,000 | 908,000,000 | -133,000,000 | -1,676,000,000 |
| Change In Receivables | -257,000,000 | -329,000,000 | 489,000,000 | -504,000,000 |
| Changes In Account Receivables | -257,000,000 | -329,000,000 | 489,000,000 | -504,000,000 |
| Stock Based Compensation | 709,000,000 | 804,000,000 | 755,000,000 | 638,000,000 |
| Deferred Tax | -288,000,000 | -497,000,000 | -117,000,000 | -650,000,000 |
| Deferred Income Tax | -288,000,000 | -497,000,000 | -117,000,000 | -650,000,000 |
| Depreciation Amortization Depletion | 808,000,000 | 844,000,000 | 859,000,000 | 840,000,000 |
| Depreciation And Amortization | 808,000,000 | 844,000,000 | 859,000,000 | 840,000,000 |
| Amortization Cash Flow | 33,000,000 | 48,000,000 | 156,000,000 | 123,000,000 |
| Amortization Of Intangibles | 33,000,000 | 48,000,000 | 156,000,000 | 123,000,000 |
| Depreciation | 775,000,000 | 796,000,000 | 703,000,000 | 717,000,000 |
| Operating Gains Losses | 37,000,000 | -138,000,000 | -213,000,000 | -26,000,000 |
| Net Foreign Currency Exchange Gain Loss | 37,000,000 | -138,000,000 | -213,000,000 | -26,000,000 |
| Net Income From Continuing Operations | 3,219,000,000 | 5,700,000,000 | 5,070,000,000 | 6,046,000,000 |
income_statement_df = ticker.income_stmt.dropna(axis=1, thresh=10)
income_statement_df
| 2025-05-31 | 2024-05-31 | 2023-05-31 | 2022-05-31 | |
|---|---|---|---|---|
| Tax Effect Of Unusual Items | 0 | 0 | 0 | 0 |
| Tax Rate For Calcs | 0 | 0 | 0 | 0 |
| Normalized EBITDA | 4,510,000,000 | 7,155,000,000 | 6,774,000,000 | 7,515,000,000 |
| Net Income From Continuing Operation Net Minority Interest | 3,219,000,000 | 5,700,000,000 | 5,070,000,000 | 6,046,000,000 |
| Reconciled Depreciation | 808,000,000 | 844,000,000 | 859,000,000 | 840,000,000 |
| Reconciled Cost Of Revenue | 26,519,000,000 | 28,475,000,000 | 28,925,000,000 | 25,231,000,000 |
| EBITDA | 4,510,000,000 | 7,155,000,000 | 6,774,000,000 | 7,515,000,000 |
| EBIT | 3,702,000,000 | 6,311,000,000 | 5,915,000,000 | 6,675,000,000 |
| Net Interest Income | 107,000,000 | 161,000,000 | 6,000,000 | -205,000,000 |
| Normalized Income | 3,219,000,000 | 5,700,000,000 | 5,070,000,000 | 6,046,000,000 |
| Net Income From Continuing And Discontinued Operation | 3,219,000,000 | 5,700,000,000 | 5,070,000,000 | 6,046,000,000 |
| Total Expenses | 42,607,000,000 | 45,051,000,000 | 45,302,000,000 | 40,035,000,000 |
| Diluted Average Shares | 1,487,600,000 | 1,529,700,000 | 1,569,800,000 | NaN |
| Basic Average Shares | 1,484,900,000 | 1,517,600,000 | 1,551,600,000 | NaN |
| Diluted EPS | 2 | 4 | 3 | NaN |
| Basic EPS | 2 | 4 | 3 | NaN |
| Diluted NI Availto Com Stockholders | 3,219,000,000 | 5,700,000,000 | 5,070,000,000 | 6,046,000,000 |
| Net Income Common Stockholders | 3,219,000,000 | 5,700,000,000 | 5,070,000,000 | 6,046,000,000 |
| Net Income | 3,219,000,000 | 5,700,000,000 | 5,070,000,000 | 6,046,000,000 |
| Net Income Including Noncontrolling Interests | 3,219,000,000 | 5,700,000,000 | 5,070,000,000 | 6,046,000,000 |
| Net Income Continuous Operations | 3,219,000,000 | 5,700,000,000 | 5,070,000,000 | 6,046,000,000 |
| Tax Provision | 666,000,000 | 1,000,000,000 | 1,131,000,000 | 605,000,000 |
| Pretax Income | 3,885,000,000 | 6,700,000,000 | 6,201,000,000 | 6,651,000,000 |
| Other Income Expense | 76,000,000 | 228,000,000 | 280,000,000 | 181,000,000 |
| Other Non Operating Income Expenses | 76,000,000 | 228,000,000 | 280,000,000 | 181,000,000 |
| Net Non Operating Interest Income Expense | 107,000,000 | 161,000,000 | 6,000,000 | -205,000,000 |
| Total Other Finance Cost | -107,000,000 | -161,000,000 | -6,000,000 | 205,000,000 |
| Operating Income | 3,702,000,000 | 6,311,000,000 | 5,915,000,000 | 6,675,000,000 |
| Operating Expense | 16,088,000,000 | 16,576,000,000 | 16,377,000,000 | 14,804,000,000 |
| Other Operating Expenses | NaN | NaN | 12,317,000,000 | 10,954,000,000 |
| Selling General And Administration | 16,088,000,000 | 16,576,000,000 | 16,377,000,000 | 14,804,000,000 |
| Selling And Marketing Expense | 4,689,000,000 | 4,285,000,000 | 4,060,000,000 | 3,850,000,000 |
| General And Administrative Expense | 11,399,000,000 | 12,291,000,000 | 12,317,000,000 | 10,954,000,000 |
| Other Gand A | 11,399,000,000 | 12,291,000,000 | 12,317,000,000 | 10,954,000,000 |
| Gross Profit | 19,790,000,000 | 22,887,000,000 | 22,292,000,000 | 21,479,000,000 |
| Cost Of Revenue | 26,519,000,000 | 28,475,000,000 | 28,925,000,000 | 25,231,000,000 |
| Total Revenue | 46,309,000,000 | 51,362,000,000 | 51,217,000,000 | 46,710,000,000 |
| Operating Revenue | 46,309,000,000 | 51,362,000,000 | 51,217,000,000 | 46,710,000,000 |
annual_income = ticker.income_stmt.dropna(axis=1, thresh=10)
annual_income
| 2025-05-31 | 2024-05-31 | 2023-05-31 | 2022-05-31 | |
|---|---|---|---|---|
| Tax Effect Of Unusual Items | 0 | 0 | 0 | 0 |
| Tax Rate For Calcs | 0 | 0 | 0 | 0 |
| Normalized EBITDA | 4,510,000,000 | 7,155,000,000 | 6,774,000,000 | 7,515,000,000 |
| Net Income From Continuing Operation Net Minority Interest | 3,219,000,000 | 5,700,000,000 | 5,070,000,000 | 6,046,000,000 |
| Reconciled Depreciation | 808,000,000 | 844,000,000 | 859,000,000 | 840,000,000 |
| Reconciled Cost Of Revenue | 26,519,000,000 | 28,475,000,000 | 28,925,000,000 | 25,231,000,000 |
| EBITDA | 4,510,000,000 | 7,155,000,000 | 6,774,000,000 | 7,515,000,000 |
| EBIT | 3,702,000,000 | 6,311,000,000 | 5,915,000,000 | 6,675,000,000 |
| Net Interest Income | 107,000,000 | 161,000,000 | 6,000,000 | -205,000,000 |
| Normalized Income | 3,219,000,000 | 5,700,000,000 | 5,070,000,000 | 6,046,000,000 |
| Net Income From Continuing And Discontinued Operation | 3,219,000,000 | 5,700,000,000 | 5,070,000,000 | 6,046,000,000 |
| Total Expenses | 42,607,000,000 | 45,051,000,000 | 45,302,000,000 | 40,035,000,000 |
| Diluted Average Shares | 1,487,600,000 | 1,529,700,000 | 1,569,800,000 | NaN |
| Basic Average Shares | 1,484,900,000 | 1,517,600,000 | 1,551,600,000 | NaN |
| Diluted EPS | 2 | 4 | 3 | NaN |
| Basic EPS | 2 | 4 | 3 | NaN |
| Diluted NI Availto Com Stockholders | 3,219,000,000 | 5,700,000,000 | 5,070,000,000 | 6,046,000,000 |
| Net Income Common Stockholders | 3,219,000,000 | 5,700,000,000 | 5,070,000,000 | 6,046,000,000 |
| Net Income | 3,219,000,000 | 5,700,000,000 | 5,070,000,000 | 6,046,000,000 |
| Net Income Including Noncontrolling Interests | 3,219,000,000 | 5,700,000,000 | 5,070,000,000 | 6,046,000,000 |
| Net Income Continuous Operations | 3,219,000,000 | 5,700,000,000 | 5,070,000,000 | 6,046,000,000 |
| Tax Provision | 666,000,000 | 1,000,000,000 | 1,131,000,000 | 605,000,000 |
| Pretax Income | 3,885,000,000 | 6,700,000,000 | 6,201,000,000 | 6,651,000,000 |
| Other Income Expense | 76,000,000 | 228,000,000 | 280,000,000 | 181,000,000 |
| Other Non Operating Income Expenses | 76,000,000 | 228,000,000 | 280,000,000 | 181,000,000 |
| Net Non Operating Interest Income Expense | 107,000,000 | 161,000,000 | 6,000,000 | -205,000,000 |
| Total Other Finance Cost | -107,000,000 | -161,000,000 | -6,000,000 | 205,000,000 |
| Operating Income | 3,702,000,000 | 6,311,000,000 | 5,915,000,000 | 6,675,000,000 |
| Operating Expense | 16,088,000,000 | 16,576,000,000 | 16,377,000,000 | 14,804,000,000 |
| Other Operating Expenses | NaN | NaN | 12,317,000,000 | 10,954,000,000 |
| Selling General And Administration | 16,088,000,000 | 16,576,000,000 | 16,377,000,000 | 14,804,000,000 |
| Selling And Marketing Expense | 4,689,000,000 | 4,285,000,000 | 4,060,000,000 | 3,850,000,000 |
| General And Administrative Expense | 11,399,000,000 | 12,291,000,000 | 12,317,000,000 | 10,954,000,000 |
| Other Gand A | 11,399,000,000 | 12,291,000,000 | 12,317,000,000 | 10,954,000,000 |
| Gross Profit | 19,790,000,000 | 22,887,000,000 | 22,292,000,000 | 21,479,000,000 |
| Cost Of Revenue | 26,519,000,000 | 28,475,000,000 | 28,925,000,000 | 25,231,000,000 |
| Total Revenue | 46,309,000,000 | 51,362,000,000 | 51,217,000,000 | 46,710,000,000 |
| Operating Revenue | 46,309,000,000 | 51,362,000,000 | 51,217,000,000 | 46,710,000,000 |
annual_cash_flow = ticker.cashflow
annual_cash_flow
| 2025-05-31 | 2024-05-31 | 2023-05-31 | 2022-05-31 | |
|---|---|---|---|---|
| Free Cash Flow | 3,268,000,000 | 6,617,000,000 | 4,872,000,000 | 4,430,000,000 |
| Repurchase Of Capital Stock | -2,985,000,000 | -4,250,000,000 | -5,480,000,000 | -4,014,000,000 |
| Repayment Of Debt | -1,000,000,000 | 0 | -500,000,000 | 0 |
| Issuance Of Debt | NaN | NaN | NaN | 0 |
| Capital Expenditure | -430,000,000 | -812,000,000 | -969,000,000 | -758,000,000 |
| Interest Paid Supplemental Data | 389,000,000 | 381,000,000 | 347,000,000 | 290,000,000 |
| Income Tax Paid Supplemental Data | 1,226,000,000 | 1,299,000,000 | 1,517,000,000 | 1,231,000,000 |
| End Cash Position | 7,464,000,000 | 9,860,000,000 | 7,441,000,000 | 8,574,000,000 |
| Beginning Cash Position | 9,860,000,000 | 7,441,000,000 | 8,574,000,000 | 9,889,000,000 |
| Effect Of Exchange Rate Changes | 1,000,000 | -16,000,000 | -91,000,000 | -143,000,000 |
| Changes In Cash | -2,397,000,000 | 2,435,000,000 | -1,042,000,000 | -1,172,000,000 |
| Financing Cash Flow | -5,820,000,000 | -5,888,000,000 | -7,447,000,000 | -4,836,000,000 |
| Cash Flow From Continuing Financing Activities | -5,820,000,000 | -5,888,000,000 | -7,447,000,000 | -4,836,000,000 |
| Net Other Financing Charges | -85,000,000 | -136,000,000 | -102,000,000 | -151,000,000 |
| Proceeds From Stock Option Exercised | 551,000,000 | 667,000,000 | 651,000,000 | 1,151,000,000 |
| Cash Dividends Paid | -2,300,000,000 | -2,169,000,000 | -2,012,000,000 | -1,837,000,000 |
| Common Stock Dividend Paid | -2,300,000,000 | -2,169,000,000 | -2,012,000,000 | -1,837,000,000 |
| Net Common Stock Issuance | -2,985,000,000 | -4,250,000,000 | -5,480,000,000 | -4,014,000,000 |
| Common Stock Payments | -2,985,000,000 | -4,250,000,000 | -5,480,000,000 | -4,014,000,000 |
| Net Issuance Payments Of Debt | -1,001,000,000 | 0 | -504,000,000 | 15,000,000 |
| Net Short Term Debt Issuance | -1,000,000 | 0 | -4,000,000 | 15,000,000 |
| Net Long Term Debt Issuance | -1,000,000,000 | 0 | -500,000,000 | 0 |
| Long Term Debt Payments | -1,000,000,000 | 0 | -500,000,000 | 0 |
| Long Term Debt Issuance | NaN | NaN | NaN | 0 |
| Investing Cash Flow | -275,000,000 | 894,000,000 | 564,000,000 | -1,524,000,000 |
| Cash Flow From Continuing Investing Activities | -275,000,000 | 894,000,000 | 564,000,000 | -1,524,000,000 |
| Net Other Investing Changes | 8,000,000 | -15,000,000 | 52,000,000 | -19,000,000 |
| Net Investment Purchase And Sale | 147,000,000 | 1,721,000,000 | 1,481,000,000 | -747,000,000 |
| Sale Of Investment | 3,381,000,000 | 6,488,000,000 | 7,540,000,000 | 12,166,000,000 |
| Purchase Of Investment | -3,234,000,000 | -4,767,000,000 | -6,059,000,000 | -12,913,000,000 |
| Net PPE Purchase And Sale | -430,000,000 | -812,000,000 | -969,000,000 | -758,000,000 |
| Purchase Of PPE | -430,000,000 | -812,000,000 | -969,000,000 | -758,000,000 |
| Operating Cash Flow | 3,698,000,000 | 7,429,000,000 | 5,841,000,000 | 5,188,000,000 |
| Cash Flow From Continuing Operating Activities | 3,698,000,000 | 7,429,000,000 | 5,841,000,000 | 5,188,000,000 |
| Change In Working Capital | -787,000,000 | 716,000,000 | -513,000,000 | -1,660,000,000 |
| Change In Payables And Accrued Expense | -426,000,000 | 397,000,000 | -225,000,000 | 1,365,000,000 |
| Change In Payable | -426,000,000 | 397,000,000 | -225,000,000 | 1,365,000,000 |
| Change In Account Payable | -426,000,000 | 397,000,000 | -225,000,000 | 1,365,000,000 |
| Change In Prepaid Assets | -224,000,000 | -260,000,000 | -644,000,000 | -845,000,000 |
| Change In Inventory | 120,000,000 | 908,000,000 | -133,000,000 | -1,676,000,000 |
| Change In Receivables | -257,000,000 | -329,000,000 | 489,000,000 | -504,000,000 |
| Changes In Account Receivables | -257,000,000 | -329,000,000 | 489,000,000 | -504,000,000 |
| Stock Based Compensation | 709,000,000 | 804,000,000 | 755,000,000 | 638,000,000 |
| Deferred Tax | -288,000,000 | -497,000,000 | -117,000,000 | -650,000,000 |
| Deferred Income Tax | -288,000,000 | -497,000,000 | -117,000,000 | -650,000,000 |
| Depreciation Amortization Depletion | 808,000,000 | 844,000,000 | 859,000,000 | 840,000,000 |
| Depreciation And Amortization | 808,000,000 | 844,000,000 | 859,000,000 | 840,000,000 |
| Amortization Cash Flow | 33,000,000 | 48,000,000 | 156,000,000 | 123,000,000 |
| Amortization Of Intangibles | 33,000,000 | 48,000,000 | 156,000,000 | 123,000,000 |
| Depreciation | 775,000,000 | 796,000,000 | 703,000,000 | 717,000,000 |
| Operating Gains Losses | 37,000,000 | -138,000,000 | -213,000,000 | -26,000,000 |
| Net Foreign Currency Exchange Gain Loss | 37,000,000 | -138,000,000 | -213,000,000 | -26,000,000 |
| Net Income From Continuing Operations | 3,219,000,000 | 5,700,000,000 | 5,070,000,000 | 6,046,000,000 |
annual_balance_sheet = ticker.balance_sheet
annual_balance_sheet = annual_balance_sheet.fillna(0)
annual_balance_sheet
| 2025-05-31 | 2024-05-31 | 2023-05-31 | 2022-05-31 | |
|---|---|---|---|---|
| Ordinary Shares Number | 1,476,000,000 | 1,503,000,000 | 1,532,000,000 | 1,571,000,000 |
| Share Issued | 1,476,000,000 | 1,503,000,000 | 1,532,000,000 | 1,571,000,000 |
| Net Debt | 502,000,000 | 0 | 1,492,000,000 | 856,000,000 |
| Total Debt | 11,018,000,000 | 11,952,000,000 | 12,144,000,000 | 12,627,000,000 |
| Tangible Book Value | 12,714,000,000 | 13,931,000,000 | 13,449,000,000 | 14,711,000,000 |
| ... | ... | ... | ... | ... |
| Cash Cash Equivalents And Short Term Investments | 9,151,000,000 | 11,582,000,000 | 10,675,000,000 | 12,997,000,000 |
| Other Short Term Investments | 1,687,000,000 | 1,722,000,000 | 3,234,000,000 | 4,423,000,000 |
| Cash And Cash Equivalents | 7,464,000,000 | 9,860,000,000 | 7,441,000,000 | 8,574,000,000 |
| Cash Equivalents | 6,243,000,000 | 8,638,000,000 | 5,674,000,000 | 7,735,000,000 |
| Cash Financial | 1,221,000,000 | 1,222,000,000 | 1,767,000,000 | 839,000,000 |
75 rows × 4 columns
# FCFF Calculation using Cash Flow Statement and Income Statement Inputs
free_cash_flow_firm = (cash_flow_df.loc['Free Cash Flow'].astype('int64')) \
                    + (income_statement_df.loc['Net Non Operating Interest Income Expense'].astype('int64') \
                        * (1 - income_statement_df.loc['Tax Provision'].astype('int64') \
                           / income_statement_df.loc['Pretax Income'].astype('int64'))).astype('int64')

# Change Series to a Pandas Dataframe
free_cash_flow_firm_df = free_cash_flow_firm.to_frame().transpose()
print(free_cash_flow_firm_df)
print(cash_flow_df.loc['Free Cash Flow'][0])
print(income_statement_df.loc['Net Non Operating Interest Income Expense'][0])
print(income_statement_df.loc['Tax Provision'][0])
print(income_statement_df.loc['Pretax Income'][0])
print((1 - income_statement_df.loc['Tax Provision'][0] \
                           / income_statement_df.loc['Pretax Income'][0]))
print(income_statement_df.loc['Net Non Operating Interest Income Expense'][0] *(1 - income_statement_df.loc['Tax Provision'][0] \
                           / income_statement_df.loc['Pretax Income'][0]))
   2025-05-31  2024-05-31  2023-05-31  2022-05-31
0  3356657142  6753970149  4876905660  4243647572
3268000000.0
107000000.0
666000000.0
3885000000.0
0.8285714285714285
88657142.85714285
# CAGR of FCFF
latest_free_cash_flow_firm = float(free_cash_flow_firm_df.iloc[0,0])
earliest_free_cash_flow_firm = float(free_cash_flow_firm_df.iloc[0,len(free_cash_flow_firm_df.columns)-1])
free_cash_flow_firm_CAGR = ((latest_free_cash_flow_firm/earliest_free_cash_flow_firm)\
                            **(float(1/(len(free_cash_flow_firm_df.columns)))))-1


print(latest_free_cash_flow_firm)
print(earliest_free_cash_flow_firm)
print(free_cash_flow_firm_CAGR)
3356657142.0
4243647572.0
-0.0569343672541337
# Perpetual (terminal) growth rate.
# The historical FCFF CAGR can be negative, which implies the firm shrinks
# forever - not a valid going-concern assumption. Use a conservative long-run
# rate (~ long-run GDP / inflation) instead.
long_term_growth = 0.025
long_term_growth
0.025
# Forecasted FCFF
forecast_free_cash_flow_firm_df = pd.DataFrame(columns=['Year ' + str(i) for i in range(1,6)])
free_cash_flow_firm_forecast_lst = []
for i in range(1,6):
    if i != 5:
        free_cash_flow_firm_forecast = latest_free_cash_flow_firm*(1+free_cash_flow_firm_CAGR)**i
    else:
        free_cash_flow_firm_forecast = latest_free_cash_flow_firm*(1+free_cash_flow_firm_CAGR)\
                                        **(i-1)*(1+long_term_growth)
    free_cash_flow_firm_forecast_lst.append(int(free_cash_flow_firm_forecast))
forecast_free_cash_flow_firm_df.loc[0] = free_cash_flow_firm_forecast_lst
forecast_free_cash_flow_firm_df
| Year 1 | Year 2 | Year 3 | Year 4 | Year 5 | |
|---|---|---|---|---|---|
| 0 | 3165547991 | 2985319519 | 2815352241 | 2655061943 | 2721438491 |
# Risk-free Rate
timespan = 100
current_date = datetime.date.today()
formatted_date = current_date.strftime('%Y-%m-%d')
past_date = current_date-datetime.timedelta(days=timespan)
formatted_past_date = past_date.strftime('%Y-%m-%d')
tk = yf.Ticker('^TNX')
risk_free_rate_df = tk.history(period='3mo')
risk_free_rate = (risk_free_rate_df.iloc[len(risk_free_rate_df)-1,3])/100
risk_free_rate
c:\Users\Admin\anaconda3\lib\site-packages\yfinance\scrapers\history.py:396: FutureWarning: The default dtype for empty Series will be 'object' instead of 'float64' in a future version. Specify a dtype explicitly to silence this warning.
  self._capital_gains = pd.Series()


0.04484999656677246
import requests
from bs4 import BeautifulSoup

def finviz_fundament(symbol):
    # Finviz blocks non-browser requests and splits fundamentals across
    # multiple snapshot-table2 tables, so use a browser UA and aggregate them.
    url = f"https://finviz.com/quote.ashx?t={symbol}"
    headers = {"User-Agent": "Mozilla/5.0 (Windows NT 10.0; Win64; x64) "
                             "AppleWebKit/537.36 (KHTML, like Gecko) "
                             "Chrome/126.0 Safari/537.36"}
    resp = requests.get(url, headers=headers, timeout=15)
    resp.raise_for_status()
    soup = BeautifulSoup(resp.text, "lxml")
    cells = []
    for table in soup.find_all("table", class_="snapshot-table2"):
        cells += [td.text for td in table.find_all("td")]
    return {cells[i]: cells[i + 1] for i in range(0, len(cells) - 1, 2)}

tk = finviz_fundament('NKE')
tk
{'Index': 'DJIA, S&P 500',
 'Market Cap': '65.29B',
 'Enterprise Value': '67.30B',
 'Income': '3.11B',
 'Sales': '46.40B',
 'Book/sh': '9.52',
 'Cash/sh': '6.10',
 'Dividend Est.': '1.66 (3.76%)',
 'Dividend TTM': '1.63 (3.70%)',
 'Dividend Ex-Date': 'Jun 01, 2026',
 'Dividend Gr. 3/5Y': '7.28% 8.78%',
 'Payout': '77.67%',
 'Employees': '77800',
 'IPO': 'Dec 02, 1980',
 'P/E': '21.01',
 'Forward P/E': '19.97',
 'PEG': '4.16',
 'P/S': '1.41',
 'P/B': '4.63',
 'P/C': '7.23',
 'P/FCF': '62.30',
 'EV/EBITDA': '18.45',
 'EV/Sales': '1.45',
 'Quick Ratio': '1.36',
 'Current Ratio': '1.96',
 'Debt/Eq': '0.74',
 'LT Debt/Eq': '0.58',
 'Option/Short': 'Yes / Yes',
 'EPS (ttm)': '2.10',
 'EPS next Y': '25.94%',
 'EPS next Q': '0.44',
 'EPS this Y': '-16.54%',
 'EPS next 5Y': '4.80%',
 'EPS past 3/5Y': '-13.39% -10.02%',
 'Sales past 3/5Y': '-3.22% 0.84%',
 'EPS Y/Y TTM': '-2.96%',
 'Sales Y/Y TTM': '-0.01%',
 'EPS Q/Q': '404.83%',
 'Sales Q/Q': '-1.33%',
 'Earnings': 'Jun 30 AMC',
 'EPS/Sales Surpr.': '479.24% 1.13%',
 'Insider Own': '21.06%',
 'Insider Trans': '0.01%',
 'Inst Own': '66.28%',
 'Inst Trans': '-1.43%',
 'ROA': '8.29%',
 'ROE': '22.14%',
 'ROIC': '13.27%',
 'Gross Margin': '44.06%',
 'Oper. Margin': '8.56%',
 'Profit Margin': '6.70%',
 'SMA20': '1.63%',
 'SMA50': '0.57%',
 'SMA200': '-23.08%',
 'Trades': '\n\n',
 'Shs Outstand': '1.48B',
 'Shs Float': '1.17B',
 'Short Float': '4.88%',
 'Short Ratio': '2.28',
 'Short Interest': '57.04M',
 '52W High': '80.17 -45.00%',
 '52W Low': '40.00 10.23%',
 'Volatility': '3.79% 3.25%',
 'ATR (14)': '1.49',
 'RSI (14)': '52.93',
 'Beta': '1.11',
 'Rel Volume': '1.25',
 'Avg Volume': '25.00M',
 'Volume': '31,232,182',
 'Perf Week': '7.80%',
 'Perf Month': '0.82%',
 'Perf Quarter': '-1.21%',
 'Perf Half Y': '-27.95%',
 'Perf YTD': '-30.80%',
 'Perf Year': '-42.28%',
 'Perf 3Y': '-60.05%',
 'Perf 5Y': '-72.40%',
 'Perf 10Y': '-20.72%',
 'Recom': '2.49',
 'Target Price': '50.32',
 'Prev Close': '43.06',
 'Price': '44.09',
 'Change': '2.39%'}
beta = float(tk['Beta']) # float is for decimal and int is for integer
beta
1.11
market_risk_premium = (0.10-risk_free_rate)
market_risk_premium
0.05515000343322755
# Required Cost of Equity

coe = risk_free_rate + (beta*market_risk_premium)

coe
0.10606650037765504
interest_expense = income_statement_df.loc['Net Non Operating Interest Income Expense']
interest_expense_df = interest_expense.to_frame().transpose()
interest_expense_str = interest_expense_df.values[0][0]
interest_expense_int = int(interest_expense_str)


# Total Debt
total_debt = balance_sheet_df.loc['Total Debt']
total_debt_df = total_debt.to_frame().transpose()
total_debt_str = total_debt_df.values[0][0]
total_debt_int = int(total_debt_str)

# Required Cost of Debt
cod = interest_expense_int / total_debt_int


print(interest_expense_str)
print(total_debt_df)

print(interest_expense_int)
print(total_debt_int)
print(cod)
107000000.0
               2026-02-28     2025-11-30     2025-08-31     2025-05-31  \
Total Debt 11,178,000,000 11,282,000,000 11,061,000,000 11,018,000,000

               2025-02-28  2024-11-30
Total Debt 11,911,000,000         NaN
107000000
11178000000
0.009572374306673823
# Effective Tax Rate
effective_tax_rate = income_statement_df.loc['Tax Provision'].astype('int64') \
                           / income_statement_df.loc['Pretax Income'].astype('int64')

print(income_statement_df.loc['Tax Provision'].astype('int64'))
print(income_statement_df.loc['Pretax Income'].astype('int64'))
print(len(effective_tax_rate))
print(sum(effective_tax_rate))
avg_effective_tax_rate = sum(effective_tax_rate) / len(effective_tax_rate)
avg_effective_tax_rate
2025-05-31     666000000
2024-05-31    1000000000
2023-05-31    1131000000
2022-05-31     605000000
Name: Tax Provision, dtype: int64
2025-05-31    3885000000
2024-05-31    6700000000
2023-05-31    6201000000
2022-05-31    6651000000
Name: Pretax Income, dtype: int64
4
0.5940360047261646


0.14850900118154114
market_cap_str = tk['Market Cap']

market_cap_lst = market_cap_str.split('.')
if market_cap_str[len(market_cap_str)-1] == 'T':
    market_cap_length = len(market_cap_lst[1])-1
    market_cap_lst[1] = market_cap_lst[1].replace('T',(12-market_cap_length)*'0')
    market_cap_int = int(''.join(market_cap_lst))
if market_cap_str[len(market_cap_str)-1] == 'B':
    market_cap_length = len(market_cap_lst[1])-1
    market_cap_lst[1] = market_cap_lst[1].replace('B',(9-market_cap_length)*'0')
    market_cap_int = int(''.join(market_cap_lst))

market_cap_int
65290000000
last_cf = cash_flow_df.loc['End Cash Position']
last_cf_df = last_cf.to_frame().transpose()
last_cf_str = last_cf_df.values[0][0]
last_cf_int = int(last_cf_str)

last_equity = balance_sheet_df.loc['Total Equity Gross Minority Interest']
last_equity_df = last_equity.to_frame().transpose()
last_equity_str = last_equity_df.values[0][0]
last_equity_int = int(last_equity_str)


enterprise_value = market_cap_int + total_debt_int - last_cf_int

print(last_cf_int)
print(last_equity_int)
print(enterprise_value)
7464000000
14090000000
69004000000
WACC = ((last_equity_int/(last_equity_int + total_debt_int)) * coe) \
        + ((total_debt_int/(last_equity_int + total_debt_int)) * cod * (1-avg_effective_tax_rate))

WACC
0.0627507728033376
# Equity Value Calculation
discounted_FCFF_lst = []
for year in range(0,5):
    discounted_FCFF = forecast_free_cash_flow_firm_df.iloc[0,year]/(1+WACC)**(year+1)
    discounted_FCFF_lst.append(int(discounted_FCFF))
terminal_value = (forecast_free_cash_flow_firm_df.iloc[0,4]*(1+long_term_growth))/(WACC-long_term_growth)
PV_terminal_value = int(terminal_value/(1+WACC)**5)
firm_value = sum(discounted_FCFF_lst)+PV_terminal_value
equity_value = (firm_value - total_debt_int + last_cf_int)

print(discounted_FCFF_lst)
print(terminal_value)
print(forecast_free_cash_flow_firm_df.iloc[0,4])
print(firm_value)
print(equity_value)
[2978636263, 2643187438, 2345516274, 2081368319, 2007434463]
73891850315.40277
2721438491
66561525614
62847525614
# Total Shares Outstanding
shares_outstanding_str = tk['Shs Outstand']

shares_outstanding_lst = shares_outstanding_str.split('.')
if shares_outstanding_str[len(shares_outstanding_str)-1] == 'T':
    shares_outstanding_length = len(shares_outstanding_lst[1])-1
    shares_outstanding_lst[1] = shares_outstanding_lst[1].replace('T',(12-shares_outstanding_length)*'0')
    shares_outstanding_int = int(''.join(shares_outstanding_lst))
if shares_outstanding_str[len(shares_outstanding_str)-1] == 'B':
    shares_outstanding_length = len(shares_outstanding_lst[1])-1
    shares_outstanding_lst[1] = shares_outstanding_lst[1].replace('B',(9-shares_outstanding_length)*'0')
    shares_outstanding_int = int(''.join(shares_outstanding_lst))
if shares_outstanding_str[len(shares_outstanding_str)-1] == 'M':
    shares_outstanding_length = len(shares_outstanding_lst[1])-1
    shares_outstanding_lst[1] = shares_outstanding_lst[1].replace('M',(6-shares_outstanding_length)*'0')
    shares_outstanding_int = int(''.join(shares_outstanding_lst))

shares_outstanding_int
1480000000
# Two-stage FCFF Valuation Model Stock Price Estimate
stock_price = equity_value / shares_outstanding_int
stock_price = '${:,.2f}'.format(stock_price)
print("Model Stock Price = %s"%(stock_price))

# Actual Stock Price
actual_stock_price = market_cap_int / shares_outstanding_int
actual_stock_price = '${:,.2f}'.format(actual_stock_price)
print("Actual Stock Price = %s"%(actual_stock_price))
Model Stock Price = $42.46
Actual Stock Price = $44.11
   Reportable Operating Segments - Schedule of Operating Segment Information (Details) - USD ($)  $ in Thousands 12 Months Ended
   Reportable Operating Segments - Schedule of Operating Segment Information (Details) - USD ($)  $ in Thousands   Mar. 31, 2026 Mar. 31, 2025 Mar. 31, 2024
0                                                                     Segment Reporting Information [Line Items]             NaN           NaN           NaN
1                                                                                                      Net sales     $ 5,472,296   $ 4,985,612   $ 4,287,763
2                                                                                            Less: Cost of sales         2314570       2099949       1902275
3                                                                                                   Gross profit     $ 3,157,726   $ 2,885,663   $ 2,385,488
4                                                                                           Segment gross margin          57.70%        57.90%        55.60%
5                                                                                                          Less:             NaN           NaN           NaN
6                                                                                      Payroll and related costs       $ 307,073     $ 265,328     $ 226,926
7                                                                 Advertising, marketing, and promotion expenses          495838        432198        348852
8                                                                                             Rent and occupancy          130571        102615         92661
9                                                                           Depreciation and other related costs           20184         19445         22718
10                                                                                           Other segment items          231384        180121        146736
11                                                                                         Segment SG&A expenses         1185050        999707        837893
12                                                                                Segment income from operations     $ 1,972,676   $ 1,885,956   $ 1,547,595
13                                                                                      Segment operating margin          36.00%        37.80%        36.10%
14                                                                               Impairment of intangible assets             $ 0           $ 0       $ 8,164
15                                                                                     UGG | Reportable segments             NaN           NaN           NaN
16                                                                    Segment Reporting Information [Line Items]             NaN           NaN           NaN
17
Peer Comparison — NKE vs DECK (Hoka) vs ONON (On) vs ADDYY (Adidas)
Below we reuse the same two-stage FCFF DCF and layer in price-performance metrics and a qualitative read. Note: DECK reports in USD; ONON reports in CHF and ADDYY in EUR, while market data (price, market cap, shares) comes from Finviz in USD — so their model prices mix reporting currency with USD market data and should be read as rough, not precise.
import numpy as np

peers = ['NKE', 'DECK', 'ONON', 'ADDYY']

def _num(s):
    # Parse Finviz shorthand like '65.29B', '1.48B', '29.92M', '44.09'
    if s is None:
        return np.nan
    s = str(s).strip().replace(',', '')
    mult = {'T': 1e12, 'B': 1e9, 'M': 1e6, 'K': 1e3}
    if s and s[-1] in mult:
        try:
            return float(s[:-1]) * mult[s[-1]]
        except ValueError:
            return np.nan
    try:
        return float(s)
    except ValueError:
        return np.nan

def fcff_valuation(symbol, long_term_growth=0.025, market_return=0.10):
    tkr = yf.Ticker(symbol)
    cf  = tkr.cashflow
    inc = tkr.income_stmt.dropna(axis=1, thresh=10)
    bs  = tkr.quarterly_balance_sheet

    # Market data: Finviz first, fall back to yfinance (e.g. OTC ADRs like ADDYY)
    try:
        fv = finviz_fundament(symbol)
        beta = _num(fv.get('Beta')); shares = _num(fv.get('Shs Outstand'))
        mcap = _num(fv.get('Market Cap')); price = _num(fv.get('Price'))
    except Exception:
        info = tkr.info
        beta = info.get('beta'); shares = info.get('sharesOutstanding')
        mcap = info.get('marketCap')
        price = info.get('currentPrice', info.get('regularMarketPrice'))
    beta   = np.nan if beta   is None else float(beta)
    shares = np.nan if shares is None else float(shares)
    mcap   = np.nan if mcap   is None else float(mcap)
    price  = np.nan if price  is None else float(price)

    # Effective tax rate (clip to a sane range, fall back to 21%)
    if 'Tax Provision' in inc.index and 'Pretax Income' in inc.index:
        eff = inc.loc['Tax Provision'].dropna() / inc.loc['Pretax Income'].dropna()
        eff = eff[(eff > 0) & (eff < 0.35)]
        eff_tax = float(eff.mean()) if len(eff) else 0.21
    else:
        eff_tax = 0.21

    # FCFF = Free Cash Flow + after-tax non-operating interest
    fcf = cf.loc['Free Cash Flow'].dropna().astype(float)
    if 'Net Non Operating Interest Income Expense' in inc.index:
        nnoi = inc.loc['Net Non Operating Interest Income Expense'].dropna().astype(float)
        fcff = (fcf + nnoi * (1 - eff_tax)).dropna()
    else:
        fcff = fcf
    fcff = fcff.sort_index(ascending=False)          # newest first
    latest, earliest, n = float(fcff.iloc[0]), float(fcff.iloc[-1]), len(fcff)
    cagr = (latest / earliest) ** (1 / n) - 1 if (latest > 0 and earliest > 0) else 0.0

    # 5-year forecast (fade final year to terminal growth)
    fc = [latest * (1 + cagr) ** i if i != 5 else latest * (1 + cagr) ** (i - 1) * (1 + long_term_growth)
          for i in range(1, 6)]

    # Cost of equity (CAPM), floored at the risk-free rate
    beta = 1.0 if np.isnan(beta) else beta
    coe = max(risk_free_rate + beta * (market_return - risk_free_rate), risk_free_rate)

    # Cost of debt + WACC
    total_debt = int(bs.loc['Total Debt'].dropna().iloc[0]) if 'Total Debt' in bs.index else 0
    equity_bv  = int(bs.loc['Total Equity Gross Minority Interest'].dropna().iloc[0])
    int_exp    = int(inc.loc['Net Non Operating Interest Income Expense'].dropna().iloc[0]) if 'Net Non Operating Interest Income Expense' in inc.index else 0
    cod  = (int_exp / total_debt) if total_debt else 0.0
    wacc = ((equity_bv / (equity_bv + total_debt)) * coe
            + (total_debt / (equity_bv + total_debt)) * cod * (1 - eff_tax)) if (equity_bv + total_debt) else coe

    # Terminal value (keep WACC > g)
    g = long_term_growth if wacc > long_term_growth else wacc - 0.01
    disc = [fc[y] / (1 + wacc) ** (y + 1) for y in range(5)]
    tv    = (fc[4] * (1 + g)) / (wacc - g)
    firm_value = sum(disc) + tv / (1 + wacc) ** 5

    cash = int(cf.loc['End Cash Position'].dropna().iloc[0]) if 'End Cash Position' in cf.index else 0
    equity_value = firm_value - total_debt + cash

    model_price  = equity_value / shares if not np.isnan(shares) and shares else np.nan
    actual_price = price
    if np.isnan(actual_price) and not np.isnan(shares) and shares:
        actual_price = mcap / shares
    upside = (model_price / actual_price - 1) * 100 if (model_price and actual_price) else np.nan

    return {'Ticker': symbol, 'Beta': round(beta, 2), 'WACC': round(wacc, 4),
            'FCFF CAGR': round(cagr, 4), 'Firm Value ($B)': round(firm_value / 1e9, 2),
            'Equity Value ($B)': round(equity_value / 1e9, 2),
            'Model Price': round(model_price, 2), 'Actual Price': round(actual_price, 2),
            'Upside %': round(upside, 1)}

def performance_metrics(symbol, start='2022-01-01', end=None):
    px = yf.Ticker(symbol).history(start=start, end=end, interval='1d')['Close'].dropna()
    if len(px) < 2:
        return {'Ticker': symbol}
    daily = px.pct_change().dropna()
    years = (px.index[-1] - px.index[0]).days / 365.25
    return {'Ticker': symbol,
            'CAGR %': round(((px.iloc[-1] / px.iloc[0]) ** (1 / years) - 1) * 100, 1),
            'Cumulative %': round((px.iloc[-1] / px.iloc[0] - 1) * 100, 1),
            'Volatility %': round(daily.std() * np.sqrt(252) * 100, 1),
            'Expected Yearly %': round(daily.mean() * 252 * 100, 1),
            'Expected Monthly %': round(daily.mean() * 21 * 100, 1)}

dcf_df  = pd.DataFrame([fcff_valuation(t) for t in peers]).set_index('Ticker')
perf_df = pd.DataFrame([performance_metrics(t) for t in peers]).set_index('Ticker')

_dcf_fmt = {'Beta': '{:.2f}'.format, 'WACC': '{:.2%}'.format, 'FCFF CAGR': '{:.2%}'.format,
            'Firm Value ($B)': '{:.1f}'.format, 'Equity Value ($B)': '{:.1f}'.format,
            'Model Price': '${:.2f}'.format, 'Actual Price': '${:.2f}'.format,
            'Upside %': '{:+.1f}%'.format}
print("=== Two-stage FCFF DCF (model vs actual) ===")
print(dcf_df.to_string(formatters=_dcf_fmt))
print("\n=== Price performance (since 2022-01-01) ===")
print(perf_df.to_string(formatters={c: '{:+.1f}%'.format for c in perf_df.columns}))
c:\Users\Admin\anaconda3\lib\site-packages\yfinance\scrapers\history.py:396: FutureWarning: The default dtype for empty Series will be 'object' instead of 'float64' in a future version. Specify a dtype explicitly to silence this warning.
  self._capital_gains = pd.Series()
c:\Users\Admin\anaconda3\lib\site-packages\yfinance\scrapers\history.py:396: FutureWarning: The default dtype for empty Series will be 'object' instead of 'float64' in a future version. Specify a dtype explicitly to silence this warning.
  self._capital_gains = pd.Series()
c:\Users\Admin\anaconda3\lib\site-packages\yfinance\scrapers\history.py:396: FutureWarning: The default dtype for empty Series will be 'object' instead of 'float64' in a future version. Specify a dtype explicitly to silence this warning.
  self._capital_gains = pd.Series()
c:\Users\Admin\anaconda3\lib\site-packages\yfinance\scrapers\history.py:396: FutureWarning: The default dtype for empty Series will be 'object' instead of 'float64' in a future version. Specify a dtype explicitly to silence this warning.
  self._capital_gains = pd.Series()


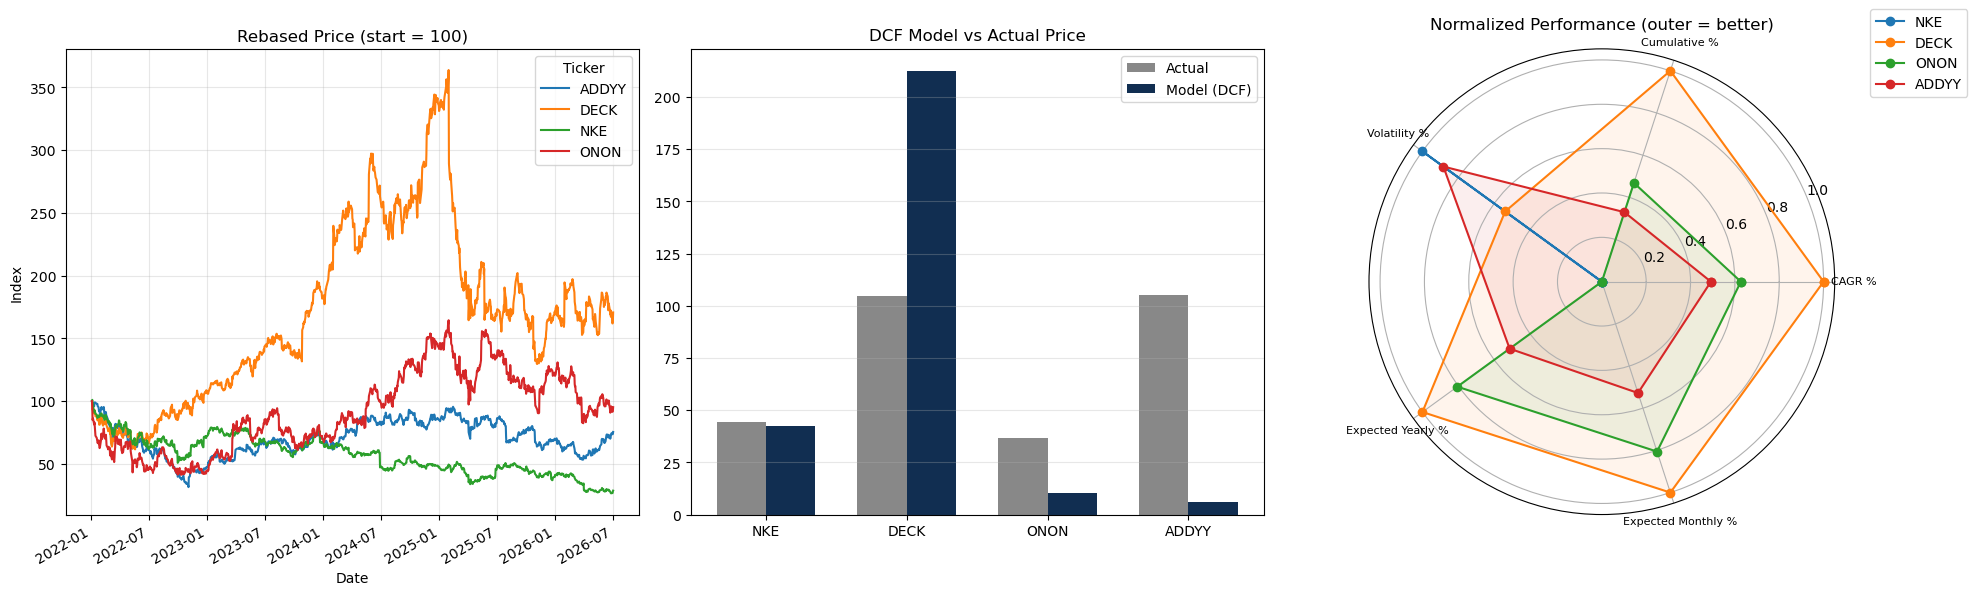
=== Two-stage FCFF DCF (model vs actual) ===
       Beta   WACC FCFF CAGR Firm Value ($B) Equity Value ($B) Model Price Actual Price Upside %
Ticker
NKE    1.11  6.28%    -5.74%            66.5              62.8      $42.41       $44.09    -3.8%
DECK   1.16 11.11%    25.21%            28.2              29.7     $212.42      $104.69  +102.9%
ONON   2.12 12.44%     0.00%             2.7               3.1      $10.52       $36.83   -71.4%
ADDYY  1.21  4.84%     0.00%             6.4               2.1       $5.87      $105.15   -94.4%

=== Price performance (since 2022-01-01) ===
       CAGR % Cumulative % Volatility % Expected Yearly % Expected Monthly %
Ticker
NKE    -24.3%       -71.3%       +36.6%            -21.1%              -1.8%
DECK   +12.7%       +70.7%       +44.9%            +22.1%              +1.8%
ONON    -1.1%        -4.8%       +54.6%            +13.7%              +1.1%
ADDYY   -6.1%       -24.5%       +38.7%             +1.1%              +0.1%
import matplotlib.pyplot as plt
from math import pi

fig, axes = plt.subplots(1, 3, figsize=(20, 6))

# 1) Normalized price (rebased to 100 at start)
prices = yf.download(peers, start='2022-01-01', progress=False)['Close'].dropna(how='all')
norm = prices / prices.bfill().iloc[0] * 100
norm.plot(ax=axes[0])
axes[0].set_title('Rebased Price (start = 100)'); axes[0].set_ylabel('Index'); axes[0].grid(alpha=.3)

# 2) Model vs Actual price
x = np.arange(len(dcf_df)); w = 0.35
axes[1].bar(x - w/2, dcf_df['Actual Price'], w, label='Actual', color='#888')
axes[1].bar(x + w/2, dcf_df['Model Price'],  w, label='Model (DCF)', color='#112e51')
axes[1].set_xticks(x); axes[1].set_xticklabels(dcf_df.index)
axes[1].set_title('DCF Model vs Actual Price'); axes[1].legend(); axes[1].grid(alpha=.3, axis='y')

# 3) Radar of normalized performance (higher = better; volatility inverted)
radar = perf_df.copy()
radar['Volatility %'] = -radar['Volatility %']              # lower vol scores higher
radar_n = (radar - radar.min()) / (radar.max() - radar.min())
labels = list(radar_n.columns)
angles = np.linspace(0, 2*pi, len(labels), endpoint=False).tolist(); angles += angles[:1]
axr = plt.subplot(1, 3, 3, polar=True)
for t in radar_n.index:
    vals = radar_n.loc[t].tolist(); vals += vals[:1]
    axr.plot(angles, vals, 'o-', linewidth=1.5, label=t); axr.fill(angles, vals, alpha=0.08)
axr.set_thetagrids(np.degrees(angles[:-1]), labels, fontsize=8)
axr.set_title('Normalized Performance (outer = better)'); axr.legend(loc='upper right', bbox_to_anchor=(1.3, 1.1))

plt.tight_layout(); plt.show()
c:\Users\Admin\anaconda3\lib\site-packages\yfinance\scrapers\history.py:396: FutureWarning: The default dtype for empty Series will be 'object' instead of 'float64' in a future version. Specify a dtype explicitly to silence this warning.
  self._capital_gains = pd.Series()
c:\Users\Admin\anaconda3\lib\site-packages\yfinance\scrapers\history.py:396: FutureWarning: The default dtype for empty Series will be 'object' instead of 'float64' in a future version. Specify a dtype explicitly to silence this warning.
  self._capital_gains = pd.Series()
c:\Users\Admin\anaconda3\lib\site-packages\yfinance\scrapers\history.py:396: FutureWarning: The default dtype for empty Series will be 'object' instead of 'float64' in a future version. Specify a dtype explicitly to silence this warning.
  self._capital_gains = pd.Series()
c:\Users\Admin\anaconda3\lib\site-packages\yfinance\scrapers\history.py:396: FutureWarning: The default dtype for empty Series will be 'object' instead of 'float64' in a future version. Specify a dtype explicitly to silence this warning.
  self._capital_gains = pd.Series()
C:\Users\Admin\AppData\Local\Temp\ipykernel_16632\2091169150.py:25: MatplotlibDeprecationWarning: Auto-removal of overlapping axes is deprecated since 3.6 and will be removed two minor releases later; explicitly call ax.remove() as needed.
  axr = plt.subplot(1, 3, 3, polar=True)
Qualitative Comparison
| NKE (Nike) | DECK (Hoka/UGG) | ONON (On) | ADDYY (Adidas) | |
|---|---|---|---|---|
| Stage | Mature global leader | High-growth mid-cap | Fast-growth small-cap | Turnaround #2 player |
| Moat | Wide — brand, scale, DTC | Narrowing — brand momentum | Narrow — premium niche | Wide but dented (post-Yeezy) |
| FCFF trend | Declining (~ -6%/yr) | Strong, compounding | Low/erratic base | Recovering off a weak base |
| Growth driver | DTC + margin recovery | Hoka running franchise | Premium running + apparel | Terrace/lifestyle (Samba, Gazelle) |
| Key risk | Wholesale reset, China | Single-brand concentration | Valuation, scale, competition | Execution, FX, brand heat fading |
| Reporting ccy | USD | USD | CHF | EUR |
How the numbers tie together
- NKE — model $42 vs actual ~$44 (≈fair). Weak recent price (-71% since 2022) reflects the declining-FCFF story the DCF also captures. Lowest-risk profile (lowest volatility).
- DECK — model $212 vs actual ~$105 (+103% “upside”). Driven by a very high FCFF CAGR (~25%) extrapolated forward; treat as optimistic — a 25% growth rate compounding 5 years is aggressive, and the model is highly sensitive to it. Best actual performer (+71%).
- ONON — model $11 vs actual ~$37 (-71%). Misleading: On reports in CHF while price/shares are USD ADS, and its FCFF base is small/volatile (CAGR floored to 0). The DCF understates it — the market is pricing high future growth the model doesn’t.
- ADDYY — model $6 vs actual ~$105 (-94%). Not usable as-is: EUR financials mixed with a USD ADR price, plus an ADR-to-ordinary share ratio the model ignores. Read the qualitative turnaround story here, not the DCF number.
Takeaway: the DCF is only apples-to-apples for the USD reporters (NKE, DECK). NKE screens fairly valued and defensive; DECK screens cheap but on aggressive growth assumptions. ONON and ADDYY need a currency-consistent model (convert statements to USD and apply the correct ADR share ratio) before their model prices mean anything.
# Revenue comparison (converted to USD $B for apples-to-apples)
report_ccy = {'NKE': 'USD', 'DECK': 'USD', 'ONON': 'CHF', 'ADDYY': 'EUR'}
fx = {'USD': 1.0,
      'EUR': float(yf.Ticker('EURUSD=X').history(period='5d')['Close'].iloc[-1]),
      'CHF': float(yf.Ticker('CHFUSD=X').history(period='5d')['Close'].iloc[-1])}

rev = {}
for t in peers:
    s = yf.Ticker(t).income_stmt.loc['Total Revenue'].dropna().astype(float)
    s.index = s.index.year                      # index by fiscal-year-end year
    rev[t] = s * fx[report_ccy[t]] / 1e9        # -> USD billions
rev_df = pd.DataFrame(rev).sort_index()

# Fiscal-year-ends differ, so compute growth/CAGR on each ticker's own series
latest_yoy = {}
summary = {}
for t in peers:
    s = rev_df[t].dropna()
    yoy = (s.iloc[-1] / s.iloc[-2] - 1) * 100
    cagr = ((s.iloc[-1] / s.iloc[0]) ** (1 / (len(s) - 1)) - 1) * 100
    latest_yoy[t] = yoy
    summary[t] = {'Latest Rev ($B)': f'{s.iloc[-1]:,.1f}',
                  'Latest YoY %': f'{yoy:+.1f}%',
                  'CAGR %': f'{cagr:+.1f}%',
                  'Years': f'{s.index[0]}-{s.index[-1]}'}
summary_df = pd.DataFrame(summary).T

print("=== Total Revenue (USD $B, by fiscal-year-end year) ===")
print(rev_df.to_string(float_format=lambda v: f'{v:,.1f}'))
print("\n=== Revenue growth summary (each on its own fiscal calendar) ===")
print(summary_df.to_string())

import matplotlib.pyplot as plt
fig, axes = plt.subplots(1, 3, figsize=(20, 5))

rev_df.plot(marker='o', ax=axes[0])
axes[0].set_title('Total Revenue (USD $B)'); axes[0].set_ylabel('$B'); axes[0].grid(alpha=.3)

rebased = rev_df.apply(lambda c: c / c.dropna().iloc[0] * 100)
rebased.plot(marker='o', ax=axes[1])
axes[1].set_title('Revenue Rebased to 100 (first year each)'); axes[1].grid(alpha=.3)

lg = pd.Series(latest_yoy)
lg.plot(kind='bar', ax=axes[2], color=['#c0392b' if v < 0 else '#27ae60' for v in lg])
axes[2].axhline(0, color='k', lw=.8)
axes[2].set_title('Latest Fiscal-Year Revenue Growth'); axes[2].set_ylabel('% YoY'); axes[2].grid(alpha=.3, axis='y')

plt.tight_layout(); plt.show()
c:\Users\Admin\anaconda3\lib\site-packages\yfinance\scrapers\history.py:396: FutureWarning: The default dtype for empty Series will be 'object' instead of 'float64' in a future version. Specify a dtype explicitly to silence this warning.
  self._capital_gains = pd.Series()
c:\Users\Admin\anaconda3\lib\site-packages\yfinance\scrapers\history.py:396: FutureWarning: The default dtype for empty Series will be 'object' instead of 'float64' in a future version. Specify a dtype explicitly to silence this warning.
  self._capital_gains = pd.Series()


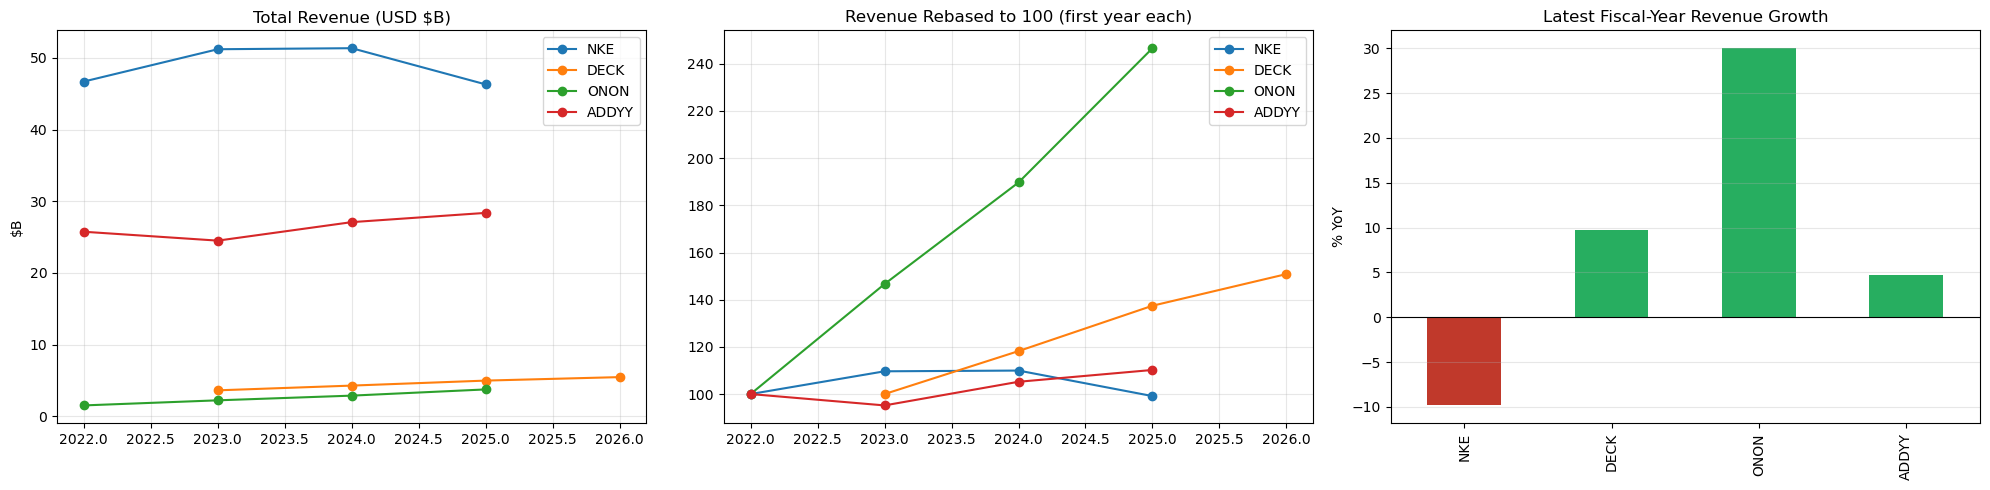
=== Total Revenue (USD $B, by fiscal-year-end year) ===
      NKE  DECK  ONON  ADDYY
2022 46.7   NaN   1.5   25.8
2023 51.2   3.6   2.2   24.5
2024 51.4   4.3   2.9   27.1
2025 46.3   5.0   3.8   28.4
2026  NaN   5.5   NaN    NaN

=== Revenue growth summary (each on its own fiscal calendar) ===
      Latest Rev ($B) Latest YoY %  CAGR %      Years
NKE              46.3        -9.8%   -0.3%  2022-2025
DECK              5.5        +9.8%  +14.7%  2023-2026
ONON              3.8       +30.0%  +35.1%  2022-2025
ADDYY            28.4        +4.8%   +3.3%  2022-2025
Revenue basis — how they differ, and why NKE is losing
Scale & trajectory (USD, latest fiscal year)
| Co. | Revenue | Latest YoY | CAGR (window) | Read |
|---|---|---|---|---|
| NKE | ~$46B | −9.8% | −0.3% | Giant, but shrinking — only one going backwards |
| ADDYY | ~$28B | +4.8% | +3.3% | #2 incumbent, recovering (Samba/Gazelle terrace wave) |
| DECK | ~$5.5B | +9.8% | +14.7% | Mid-cap compounder, Hoka is the growth engine |
| ONON | ~$3.8B | +30.0% | +35.1% | Small-cap hyper-growth, premium running |
The scale chart shows NKE ~8–12x bigger than the challengers, but the rebased chart tells the real story: NKE is the only line rolling over while ONON nearly triples and DECK keeps climbing. NKE isn’t losing on size — it’s losing on direction and momentum.
Why NKE is losing
- DTC over-pivot. Nike cut wholesale accounts (Foot Locker, DSW, Amazon, boutiques) to push direct/app sales. It gave up shelf space and doorway visibility — which On, Hoka, New Balance and Adidas rushed to fill. The margin/relationship damage outlasted the strategy, and Nike is now rebuilding those wholesale ties.
- Innovation gap. Growth leaned on retro franchises (Air Force 1, Dunk, Jordan retros) instead of new performance platforms. Flooding the market with Dunks/AF1s diluted scarcity and “brand heat,” while On (CloudTec) and Hoka (max-cushion) owned the fresh running narrative.
- Lost the running category. ONON +30% and Hoka/DECK +10–15% are taking premium run share directly. Running is the tip of the spear for credibility, and Nike ceded ground right when the category boomed.
- Lifestyle share to Adidas. Adidas’s Samba/Gazelle/terrace revival (+4.8%, recovering off a post-Yeezy trough) recaptured the fashion-sneaker zeitgeist Nike used to own.
- China + macro softness. Weak China demand and heavy promotional activity (clearing excess Dunk/AF1 inventory) pressured both revenue and gross margin simultaneously.
- Reset underway. Elliott Hill (veteran insider) returned as CEO to un-wind the DTC excess, rebuild wholesale, refresh product, and clean inventory — a multi-quarter turnaround, which is exactly why FY25 revenue (−9.8%) is the trough the market is watching.
Bottom line: the challengers are winning innovation and channel, not just price. Nike’s problem is self-inflicted (strategy + product cadence) more than competitive pricing — which is why a credible product/wholesale reset could stabilize it, but the revenue trend confirms it is currently the loser of the group.
Caveat: revenue converted to USD at current spot FX (EURUSD/CHFUSD); fiscal-year-ends differ (NKE May, DECK Mar, ONON/ADDYY Dec), so year alignment is approximate.
# === SEC filing evidence: put NUMBERS behind the qualitative story ===
# Pulls segment/disaggregation tables straight from 10-K financial-report R-files on EDGAR.
import requests, io, re
from bs4 import BeautifulSoup

SEC_HEADERS = {"User-Agent": "finance-research research@example.com"}

def _cik(tk):
    j = requests.get("https://www.sec.gov/files/company_tickers.json", headers=SEC_HEADERS, timeout=20).json()
    return next(str(r['cik_str']).zfill(10) for r in j.values() if r['ticker'].upper() == tk.upper())

def _latest(cik, forms=('10-K', '20-F')):
    rec = requests.get(f"https://data.sec.gov/submissions/CIK{cik}.json", headers=SEC_HEADERS, timeout=20).json()['filings']['recent']
    i = next(k for k, f in enumerate(rec['form']) if f in forms)
    return rec['accessionNumber'][i].replace('-', ''), rec['reportDate'][i]

def _clean(v):
    if pd.isna(v):
        return None
    s = str(v).replace('$', '').replace(',', '').replace('%', '').replace('(', '-').replace(')', '').strip()
    try:
        return float(s)
    except ValueError:
        return None

def _extract(df, metric='Revenues'):
    out, last = {}, None
    for _, r in df.iterrows():
        lab = str(r.iloc[0]).strip()
        if lab.lower().startswith(metric.lower()):
            vals = [_clean(r.iloc[c]) for c in range(1, min(4, df.shape[1]))]
            if any(v is not None for v in vals) and last:
                out[last] = vals
        elif lab and lab.lower() != 'nan' and '[line items]' not in lab.lower() \
                and 'disaggregation' not in lab.lower() and 'reporting information' not in lab.lower():
            last = re.sub(r'^Operating Segments \| ', '', lab)
    return out

def sec_table(tk, shortname_kw, metric='Revenues', forms=('10-K', '20-F')):
    cik = _cik(tk); acc, rdate = _latest(cik, forms)
    base = f"https://www.sec.gov/Archives/edgar/data/{int(cik)}/{acc}"
    fs = BeautifulSoup(requests.get(f"{base}/FilingSummary.xml", headers=SEC_HEADERS, timeout=20).text, 'lxml-xml')
    fn = next(r.find('HtmlFileName').text for r in fs.find_all('Report')
              if r.find('HtmlFileName') and shortname_kw in r.find('ShortName').text.lower())
    df = pd.read_html(io.StringIO(requests.get(f"{base}/{fn}", headers=SEC_HEADERS, timeout=20).text))[0]
    return _extract(df, metric), rdate

# ---- NIKE: geography, channel, product (from FY2025 10-K, $M, FY25/FY24/FY23) ----
nke_geo, nke_date = sec_table('NKE', 'information by operating segments', 'Revenues', forms=('10-K',))
nke_dis, _        = sec_table('NKE', 'disaggregation of revenue', 'Revenues', forms=('10-K',))
yrs = ['FY25', 'FY24', 'FY23']

geo_keys = {'North America': 'NIKE Brand | NORTH AMERICA', 'EMEA': 'NIKE Brand | EUROPE, MIDDLE EAST & AFRICA',
            'Greater China': 'NIKE Brand | GREATER CHINA', 'APLA': 'NIKE Brand | ASIA PACIFIC & LATIN AMERICA'}
geo_df = pd.DataFrame({k: nke_geo[v] for k, v in geo_keys.items()}, index=yrs).T
chan_df = pd.DataFrame({'Wholesale': nke_dis['Sales to Wholesale Customers'],
                        'DTC (Nike Direct)': nke_dis['Sales through Direct to Consumer']}, index=yrs).T
prod_df = pd.DataFrame({'Footwear': nke_dis['Footwear'], 'Apparel': nke_dis['Apparel'],
                        'Equipment': nke_dis['Equipment']}, index=yrs).T
for d in (geo_df, chan_df, prod_df):
    d['YoY %'] = (d['FY25'] / d['FY24'] - 1) * 100

# ---- Competitor brand growth: HOKA (from DECK 10-K) ----
deck_seg, deck_date = sec_table('DECK', 'operating segment information', 'Net sales', forms=('10-K',))
hoka = next(v for k, v in deck_seg.items() if 'HOKA' in k.upper())          # FY26/FY25/FY24 in $K
hoka_yoy = (hoka[0] / hoka[1] - 1) * 100

_f = lambda v: f'{v:,.0f}'
_p = lambda v: f'{v:+.1f}%'
print(f"NIKE 10-K reportDate {nke_date}  |  DECK 10-K reportDate {deck_date}\n")
print("=== NIKE revenue by geography ($M) — China + macro softness ===")
print(geo_df.to_string(formatters={'FY25': _f, 'FY24': _f, 'FY23': _f, 'YoY %': _p}))
print("\n=== NIKE revenue by channel ($M) — the DTC over-pivot backfiring ===")
print(chan_df.to_string(formatters={'FY25': _f, 'FY24': _f, 'FY23': _f, 'YoY %': _p}))
print("\n=== NIKE revenue by product ($M) — footwear (innovation engine) leads the drop ===")
print(prod_df.to_string(formatters={'FY25': _f, 'FY24': _f, 'FY23': _f, 'YoY %': _p}))
print(f"\n=== Lost running/share: growth of the challengers vs NIKE footwear ===")
print(f"  NIKE Footwear    {(prod_df.loc['Footwear','YoY %']):+.1f}%")
print(f"  HOKA (DECK)      {hoka_yoy:+.1f}%   (net sales {_f(hoka[1]/1000)}M -> {_f(hoka[0]/1000)}M)")
print(f"  On (ONON total)  {latest_yoy['ONON']:+.1f}%")
print(f"  Adidas (total)   {latest_yoy['ADDYY']:+.1f}%")

# ---- Charts ----
import matplotlib.pyplot as plt
fig, ax = plt.subplots(1, 3, figsize=(20, 5))

geo_df['YoY %'].plot(kind='bar', ax=ax[0], color=['#c0392b' if v < 0 else '#27ae60' for v in geo_df['YoY %']])
ax[0].axhline(0, color='k', lw=.8); ax[0].set_title('NIKE Revenue YoY by Geography (FY25 vs FY24)')
ax[0].set_ylabel('% YoY'); ax[0].grid(alpha=.3, axis='y')

chan_df['YoY %'].plot(kind='bar', ax=ax[1], color=['#c0392b' if v < 0 else '#27ae60' for v in chan_df['YoY %']])
ax[1].axhline(0, color='k', lw=.8); ax[1].set_title('NIKE Revenue YoY by Channel — DTC fell hardest')
ax[1].set_ylabel('% YoY'); ax[1].grid(alpha=.3, axis='y')

comp = pd.Series({'NIKE\nFootwear': prod_df.loc['Footwear', 'YoY %'], 'HOKA': hoka_yoy,
                  'On': latest_yoy['ONON'], 'Adidas': latest_yoy['ADDYY']})
comp.plot(kind='bar', ax=ax[2], color=['#c0392b' if v < 0 else '#27ae60' for v in comp])
ax[2].axhline(0, color='k', lw=.8); ax[2].set_title('Nike is losing the growth: footwear vs challengers')
ax[2].set_ylabel('% YoY (latest FY)'); ax[2].grid(alpha=.3, axis='y')

plt.tight_layout(); plt.show()
NIKE 10-K reportDate 2025-05-31  |  DECK 10-K reportDate 2026-03-31

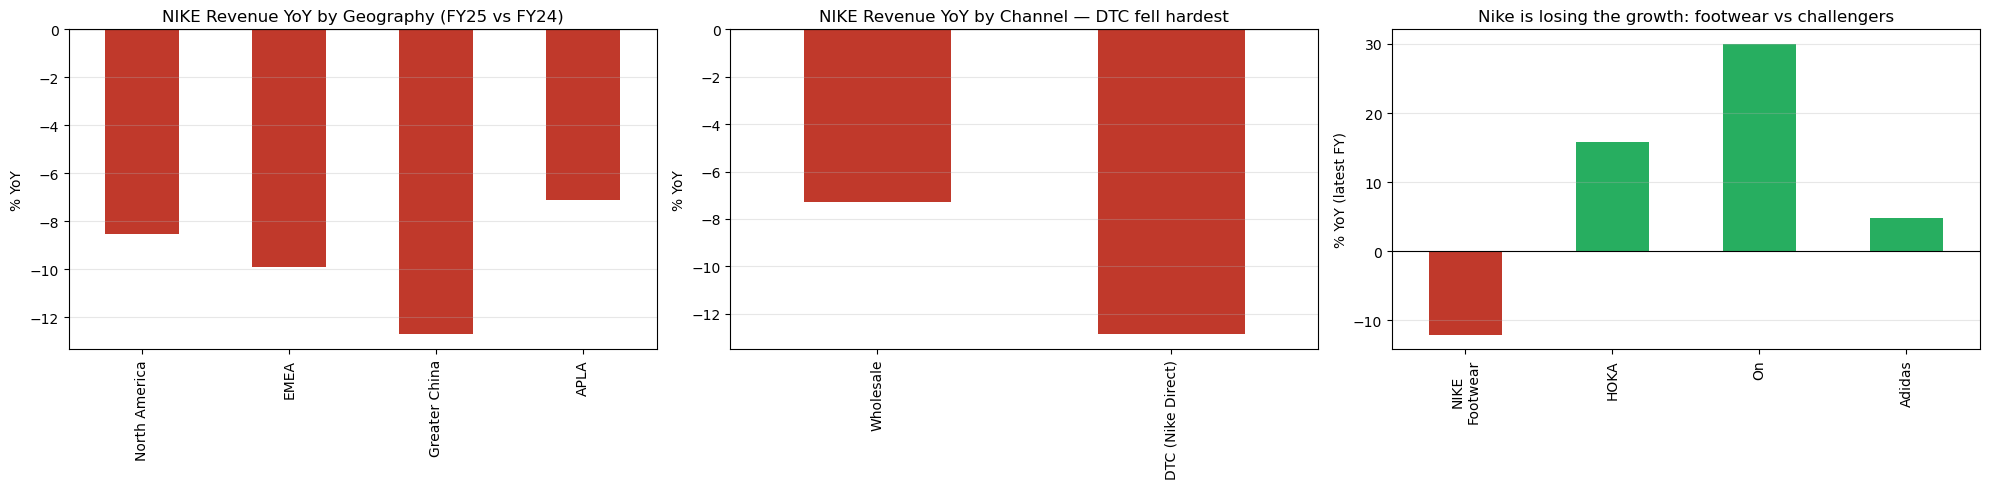
=== NIKE revenue by geography ($M) — China + macro softness ===
                FY25   FY24   FY23  YoY %
North America 19,572 21,396 21,608  -8.5%
EMEA          12,257 13,607 13,418  -9.9%
Greater China  6,586  7,545  7,248 -12.7%
APLA           6,251  6,729  6,431  -7.1%

=== NIKE revenue by channel ($M) — the DTC over-pivot backfiring ===
                    FY25   FY24   FY23  YoY %
Wholesale         26,758 28,856 28,696  -7.3%
DTC (Nike Direct) 19,477 22,351 22,282 -12.9%

=== NIKE revenue by product ($M) — footwear (innovation engine) leads the drop ===
            FY25   FY24   FY23  YoY %
Footwear  30,967 35,227 35,290 -12.1%
Apparel   13,045 13,868 13,933  -5.9%
Equipment  2,223  2,112  1,755  +5.3%

=== Lost running/share: growth of the challengers vs NIKE footwear ===
  NIKE Footwear    -12.1%
  HOKA (DECK)      +15.9%   (net sales 2,233M -> 2,587M)
  On (ONON total)  +30.0%
  Adidas (total)   +4.8%
SEC-filing evidence — the numbers behind each theme
All figures below are pulled directly from the companies’ latest 10-K financial-report tables on SEC EDGAR (NIKE FY2025 10-K, fiscal year end May 31, 2025; DECK FY2026 10-K).
| Qualitative theme | Hard number (from 10-K) | Verdict |
|---|---|---|
| China + macro softness | Greater China revenue $7,545M → $6,586M (−12.7%) — the worst-declining region (NA −8.5%, EMEA −9.9%, APLA −7.1%) | Confirmed — China is the epicenter |
| DTC over-pivot backfiring | Nike Direct −12.9% vs Wholesale −7.3% — the channel Nike bet on fell nearly 2x harder than the one it walked away from | Confirmed — the DTC pivot is the bigger drag |
| Innovation gap / franchise fatigue | Footwear −12.1% (vs Apparel −5.9%, Equipment +5.3%) — the core sneaker engine is the single largest source of decline | Confirmed — the problem is footwear, i.e. product |
| Lost the running category / share | NIKE Footwear −12.1% while HOKA +15.9% ($2,233M → $2,587M), On +30.0%, Adidas +4.8% | Confirmed — challengers are growing double digits as Nike shrinks |
Read the three charts together:
- Geography — every region is red, but Greater China is the deepest hole (−12.7%), validating the “China + macro” narrative.
- Channel — DTC (Nike Direct) fell harder than Wholesale, the numeric fingerprint of the failed direct-to-consumer over-pivot; rebuilding wholesale is exactly the reset underway.
- Footwear vs challengers — Nike’s footwear is down ~12% in the same year Hoka (+16%), On (+30%) and Adidas (+5%) grew. That gap is the lost running/lifestyle share — quantified.
One-line takeaway: Nike’s decline is concentrated in footwear, DTC, and China — a product-and-strategy problem, not a pricing one — and the exact categories where On, Hoka and Adidas are simultaneously posting double-digit growth.
Note: fiscal-year-ends differ (NIKE May, DECK Mar, On/Adidas Dec) and Nike segment figures are NIKE Brand only in reported USD; competitor totals are whole-company.
Conclusion — what Nike must do to stop losing
The data points to a clear diagnosis: the decline is concentrated in footwear (−12.1%), Nike Direct (−12.9%) and Greater China (−12.7%) — a product, channel and China problem, not a pricing one — happening in the exact categories where On (+30%), Hoka (+16%) and Adidas (+5%) are growing. The fix has to attack those same three fronts.
1. Win back product & innovation (fixes footwear −12.1%)
- Re-establish a performance-running franchise. On and Hoka took share with a clear technology story (CloudTec, max-cushion). Nike needs a flagship cushioning/running platform marketed as hard as Vaporfly was — not another retro drop.
- Cut the retro oversupply. Deliberately ration Air Force 1 / Dunk to rebuild scarcity and pricing power; stop letting franchise volume mask the innovation gap.
- Rebalance the pipeline toward newness (higher % of revenue from products <2 years old) with faster design-to-shelf cycles.
2. Rebuild wholesale without abandoning DTC (fixes Nike Direct −12.9%)
- Re-enter lost doors (Foot Locker, Amazon, DSW, specialty run) to reclaim shelf space and reach — the vacuum challengers filled.
- Reposition DTC as premium/full-price, not the whole engine — use it for launches, membership and data, not volume clearance.
- Clean inventory to stop margin-destroying promotions that trained shoppers to wait for discounts.
3. Reset Greater China (fixes China −12.7%)
- Localize product and marketing (China-specific design, local athletes/creators) rather than exporting the US line.
- Rebuild credibility with local competitors (Anta, Li-Ning) taking share; lean on running and basketball where Nike still has authority.
4. Protect the moat & the P&L
- Defend lifestyle against Adidas’s terrace wave (Samba/Gazelle) with Nike’s own low-profile silhouettes and culture partnerships.
- Reinvest the demand-creation budget into product storytelling (it already rose to ~$4.7B) and measure by full-price sell-through, not shipments.
- Restore gross margin through disciplined supply, fewer markdowns, and mix shift back to footwear innovation.
The scorecard to watch (from the same 10-K tables)
| Signal that the turnaround is working | Target direction |
|---|---|
| Footwear revenue YoY | −12% → flat → positive |
| Nike Direct vs Wholesale | Both stabilize; wholesale re-growing |
| Greater China revenue | Stops declining faster than the group |
| Gross margin | Recovers as promotions fade |
| % revenue from new (<2yr) product | Rising |
Bottom line: Nike doesn’t need to out-price On, Hoka or Adidas — it needs to out-innovate in footwear, rebuild the wholesale shelf it walked away from, and re-localize China. The FY25 trough (−9.8% total revenue) is the reset point; success is measured by footwear returning to growth and Nike Direct stabilizing alongside a rebuilt wholesale base — exactly the plan Elliott Hill’s leadership has signaled.